After the wettest winter on record the rest of the year was quite uneventful. Slightly warmer than average and with average rainfall.
After the record breaking December of 2015 the winter of 2015-16 was always going to be record breaking as well, but both January and February added further copious amounts of rainfall to the final total. January was the wettest month of the year and February had well above average rainfall, but gradually the rainfall totals became more in-line with the norm'.
The winter of 2015-16 whilst being the wettest on record also became the second warmest on record in the CET series.
After a mild January the next three months saw the year off to a cool start, April finishing in the grip of winter. However, from May onwards the general theme was a warm one, November being the one month to buck the trend.
Like 2015, the winter had brief wintry forays, but no sustained cold spells, albeit the end of February did see a week of frosts, although little of the white stuff. But the rest of the year just passed by without ever doing much - May was decent and September warm (but just had too many days of rain), and when the end of the year approached and thoughts turned to one of 'will there be floods this year?', the autumn was obligingly dry and quite agreeable.
November whilst being much colder than average brought a decent autumn to an end, saw some hard frosts and wintry weather and for the first time in my records the year's coldest temperature and hence the first occasion that it has fallen outside of a winter's month. It was also the month that recorded the most air frosts this year.
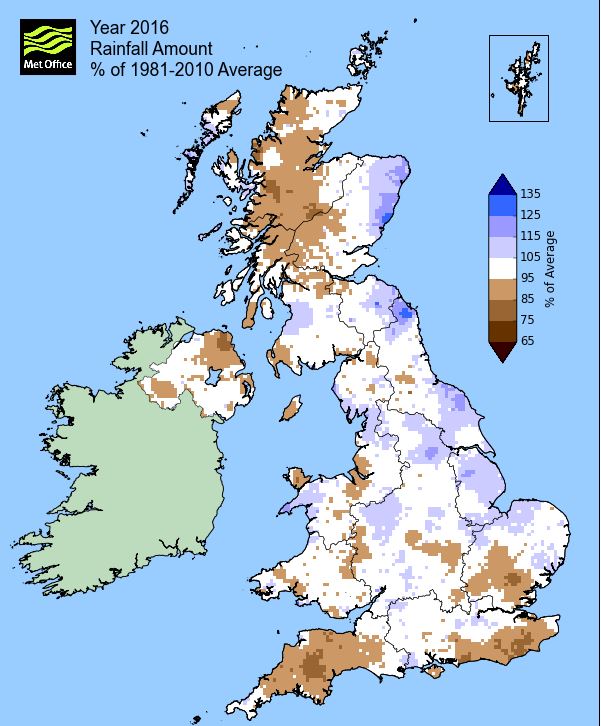
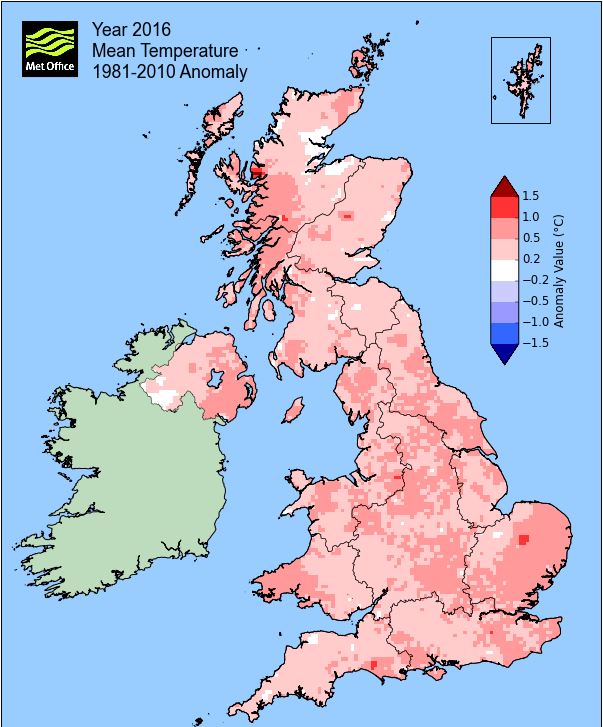
So with temperatures typically just 0.3°c above average and rainfall teetering either side of 100% of normal dependent on location, it was all very ... average.
TEMPERATURE
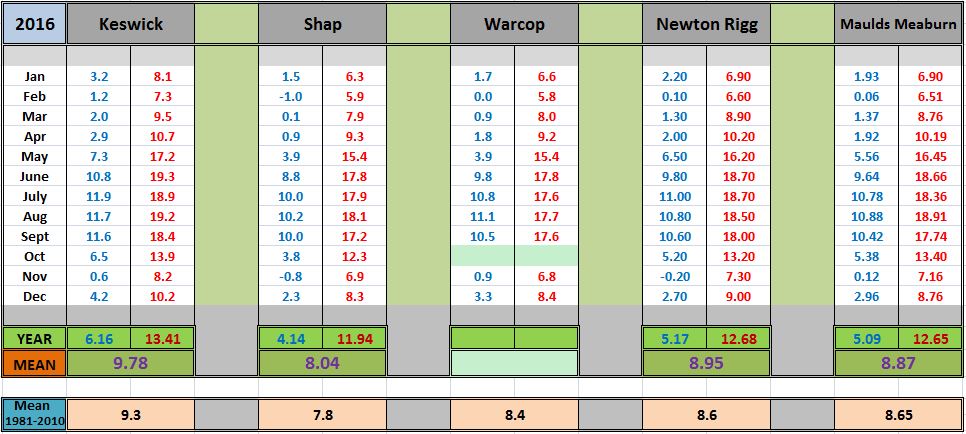
Locally all sites were just that little bit warmer than average during 2016, ranging from 0.2°c at Shap to 0.5°c at Keswick, which for at least the third year in succession was once again just that little bit more above average than everywhere else - 2016 was the warmest year since 2014.
With a mean temperature of 8.95°c (mean minimum of 5.2°c and mean maximum of 12.7°c) at Newton Rigg, 2016 becomes the 15th warmest (of 60) in a complete series back to 1957. In a far more fragmented series back to 1914 (14 years of incomplete data), it is the 16th warmest (of 88). That 8.95°c being 0.35°c above the 1981-2010 mean.
At Newton Rigg six months were warmer than average during the year, (September and December by over 2°c and three others by over 1°c), five were colder (November by over 2°c with only one other by over 1°c) and one (August) had the same mean temperature.
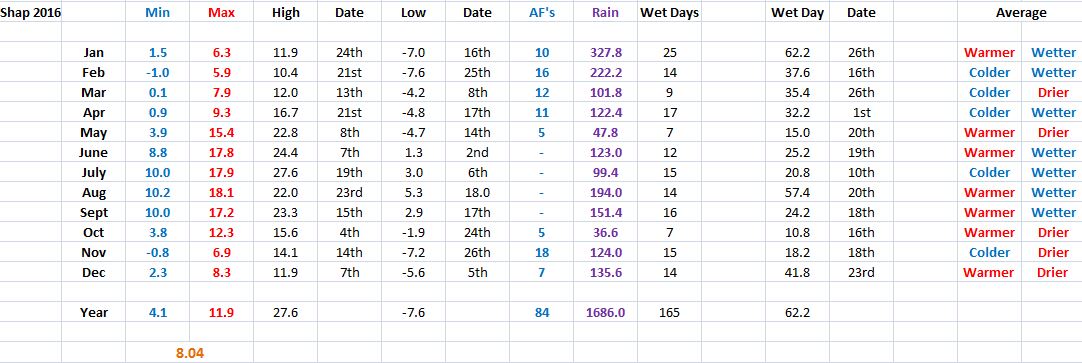
At the Met' office site at Shap 84 air frosts were recorded during 2016, its average being 74.5, which had an annual mean temperature of 8.04°c.
Here at Maulds Meaburn a mean temperature of 8.89 °c (mean minimum of 5.11°c and maximum of 12.68°c) was some 0.24°c above the average for my short period of records for 2009-2015.
The highest and lowest temperatures recorded at a standard site during 2016 were: a maximum of 30.4°c (19th July at Carlisle and Levens) and a minimum of -12.1°c (24th February at Alston).
Here at Maulds Meaburn it was: 29.5°c (85.1°f) 19th July and -5.7°c (21.7°f) on the 26th November.
A selection of monthly mean temperatures is shown below:
RAINFALL
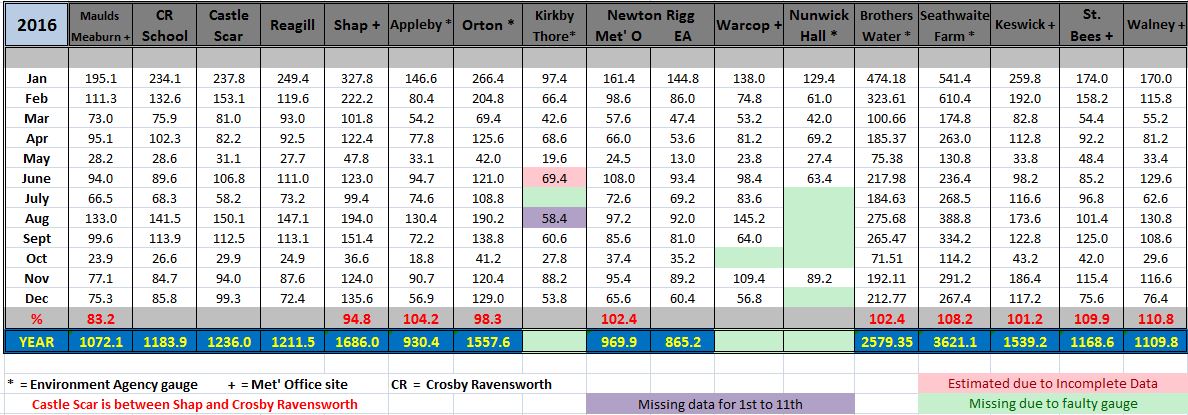
2016 was generally the driest year since 2010, but at some sites such as Newton Rigg and Seathwaite, only since 2013. Annual rainfall totals tended to hover either side of 100% of normal in what, after the wet start, was a very average year. Newton Rigg had 104.7% of its average with the average falling just below 90% of normal in the north of the county.
At Newton Rigg the rainfall record commenced in 1900 (3yrs data is incomplete) and average rainfall for 1900-2015 was 926.7 mm. The final total of 969.9 mm (104.7%) makes 2016 the 43rd wettest year in the Newton Rigg record. During the year there was an equal split of drier and wetter than average months, the six that were drier being: March, May, June, Oct', Nov' and Dec'. At Shap seven months were wetter than average, June been the month to differ.
Apart from the winter, seasonal rainfall saw spring and autumn with below average rainfall and the summer (once again) running above average, with 139% at both Shap and Newton Rigg.
Here at Maulds Meaburn there was the one drought, 9th to 23rd March, 15 days when we had no measurable rainfall and the year started with a 'rain spell' (rain recorded on every day for at least 15 days), that had re-commenced on the 23rd November 2015 and which ran until 13th January.
A selection of local rainfall totals from various standard sites is shown below:
**�Data kindly provided by the Hydrometry and Telemetry team of the Environment Agency (Penrith)�.
In an even longer series back to 1857, rainfall of 930.4 mm at Appleby makes 2016 the 66th wettest year in that time.
Since 1857 average annual rainfall in Appleby is 892.9 mm (1981-2010 average of 892.5 mm) and the 2016 total represents 104.2% of average.
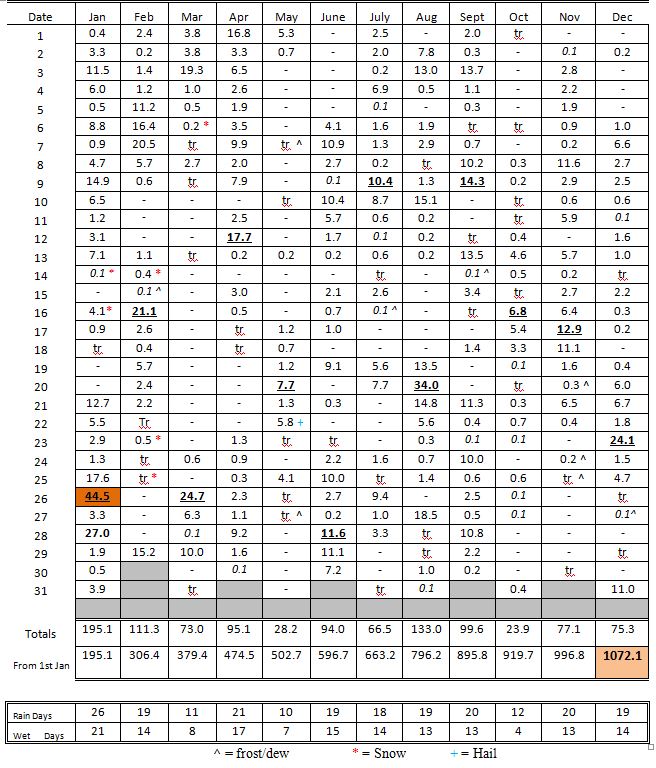
Rainfall at Maulds Meaburn was 1072.1 mm (42.21 inch) with rain recorded on 214 days (3.6 less than average) of which 153 were 'wet days' (days of 1.0 mm=>). This makes 2016 the second driest to 2010 in my nine complete years of records.
Only three days recorded an inch or more of rain, two of them falling in January which also had the year's wettest day, 44.5 mm on the 26th and which is 4.15% of the annual total.
This is the second full year that I have had a rain gauge in Crosby Ravensworth (CR), just 0.7 miles from my own gauge in Maulds Meaburn (MM) - but as expected the gauge at CR records more (it is SW of my gauge). The monthly differences between the two are still generally quite small and yet again, like 2015, June saw the MM gauge record slightly more.
The annual total of 1183.9 mm (46.61") is 110.4% of that at MM and compares quite favourably to the 114.2% of 2015 - the slight decrease quite possibly being explained by 2016 having been much drier.
Additionally this year there have been gauges at CastleHowe Scar and Reagill and the final total of 1236.0 mm at CastleHowe shows a fine correlation to that at MM and CR as the rainfall increases towards Shap.
MONTHLY SUMMARY
January saw the unsettled, wet and mild theme of winter continue and was both warmer and wetter than average and by some distance the wettest month of the year with 195.1 mm. It was always going to be an improvement on 'Desmond December' and indeed the January's of 2013+14 were both wetter than January 2016. However, rain on 26 days in the month, relentlessly dull skies and with the month becoming wetter after a mid month lull, the sense of 'Will it ever end?' did take hold!
The month was mild and unsettled at both the start and end with a notable dip in temperatures around mid month, which also had a slight wintry flavour. After that mid month cold snap it became increasingly wet and very mild from the 22nd and the mean temperature for the month, that had dropped below average during the cold snap, would now recover with eight of the last ten days attaining at least 10°c.
February brought the wettest winter on record to and end and whilst marginally cooler than average it was also wetter than average. It was mild and wet to start, then drier and cooler with frosts becoming common after mid month.
Overall it was a bit of a mixed picture, having both mild and cold spells, but at last we got to see a little sun, and something more typical of winter. However, a cold end to the month just managed to off-set the mild start to see a slightly cooler than average month, but the dry finish to the month couldn't do the same and we finished wetter than average.
The month started unsettled with 'Storm Henry' bringing gale force winds, although little rain, with the month's heaviest rain coming during the 5-8th and then on the 16th. The first frosts came as late as the 10th and then apart from a slightly milder interlude 19th-21st, the month became gradually cooler and drier with frosts recorded every day from the 23rd. However, any snowfall was insignificant and caused no disruption.
Once again all three winter months had recorded over 100 mm of rain and not surprisingly, locally, it was the wettest winter on record and by a very wide margin.
March was an average month that finished marginally cooler and with rainfall exactly on average. It was wet at both ends, but had a 15 day drought during the 9th-23rd.
After a cool first third of the month, part of which was under an Arctic airflow and thus wintry in nature, it progressively became a little warmer. And after virtually incessant rainfall since the end of October, we finally had a month, which whilst having average rainfall, actually had more days without rain than days with. Under high pressure from the 10th and remaining in control until the 23rd, we had that 15 day 'Absolute Drought' when no measurable rain was recorded and which also brought some sunny days.
However, March was, on the whole, very average, but with Easter falling early this year (25-28th) it had the misfortune to immediately follow the drought and experienced a break down in the weather that saw the Saturday become the month's wettest day, with showers and sunny intervals on Easter Sunday.
April was a backward month, both colder and wetter than average and which after spring arrived, 19th-21st, saw a return to winter through to the month's end.
Cool and wet was the general theme and when you consider that the month was 1.33°c colder than December 2015 you get an idea of the topsy-turvey weather that we had experienced over the previous six months. April may not have been anything dramatically out of the ordinary, but following the first taste of spring, for it to return to something more akin of winter at the end of the month, was the proverbial shock to the system.
The frequency of April being colder than the December that preceded it is fairly rare, at the Met' Office site at Newton Rigg it has occurred in 1921-22, 1934-35 and 1988-89. The occasions when April was colder than December in the same calendar year being: 1922, 1934, 1941, 1953 and 2015.
Generally quiet during May and which was both warmer and drier than average and with plenty of sunshine.
Add decent to quiet, as it enjoyed plenty of dry and sunny days, best during the 6-12th and again at the end of the month with the little rain that we did have tending to fall either as showers and/or at night. It was also the driest of any month since September 2014, but which would be beaten by October as the driest of 2016.
Unsettled at the very start of the month before an easterly flow brought the first taste of summer from the 6th. It became unsettled during the 17th to 22nd, before that fine end to the month.
The spring of 2016 with 196.3 mm of rain was the driest since 2010 and at Newton Rigg in comparison to the 1981-2010 averages it was 0.2°c colder than average.
In a series back to 1900 (1 year of incomplete data), spring has been drier on 34 occasions and wetter on 81 and in a complete series back to 1956, 27 have been warmer and 33 colder.
June was wetter and much warmer than average with high night-time minima notable. Warm and thundery at the start, becoming cooler and unsettled towards the end of the month.
The month started well with increasing temperatures and plenty of sun, but became hot and humid from the 6th with thunder heard on most days up to the 10th. Whilst temperatures remained above average, especially by night, the general theme then became more unsettled, although in general Cumbria avoided the worst of any rain and/or thunderstorms and daily rainfall totals were slight. However, the final five days of the month saw a more mobile and cooler westerly flow with rain becoming heavier and more frequent.
One curiosity about June is that prior to this year the 3rd June was the driest day of the year in my nine years of rainfall records, only having recorded 0.2 mm on two occasions (2008 and 2013) and the 13-15th after seven years were the only days in June not to have attained 20°c - after 2016 these two records are still intact.
Drier and marginally cooler than average in July, the month being fairly flat and quiet with a lack of warm days and sunshine with low pressure the more dominant feature.
The month simply passed by without ever getting going, having few warm days and the lack of sun was fairly noticeable. Whilst pressure never fell too low and was indeed average for July, low pressure systems generally dominated and were never too far away from the UK. During a brief warmer period, 18th-23rd, the 19th gave one especially warm day, the warmest day of the year at 29.5°c (85.1°f), but was followed on the 20th by a decent thunderstorm that lasted all morning.
The frequency of cloudy nights and thus high night-time minima was the main reason for the month's mean temperature being only marginally colder than average and indeed the mean minimum temperature was just warmer than average with the mean maximum showing a departure of just over 1°c below normal.
August was a mixed month, both marginally warmer and wetter than average and had no prolonged warm or dry spell, the 15-18th being the best on offer.
It also just never real got going. Whilst there were some good days, they were infrequent and often followed or preceded by something less good. The month started unsettled and was generally changeable during the first fortnight with a slight shift to more settled weather in the second half. However, the 20th had a notably vigorous depression for the time of year which brought a period of wet and windy conditions, 34.0 mm of rain been recorded and which contributed towards August being the second wettest month of the year with 133.0 mm.
Summer rainfall was bang on average and despite the lack of warm days still managed to finish with a mean temperature of 14.54°c. At Newton Rigg rainfall of 277.8 mm and a mean temperature of 14.6°c in comparison to the 1981-2010 averages represented 139.7% of summer rainfall and it was 0.4°c warmer than average.
In a series back to 1900 (3 years of incomplete data), this was the 20th wettest and in a complete series back to 1957, 10 have been warmer, 46 have been colder, with 3 having the same mean temperature.
With a mean temperature of 14.08°c, some 1.8°c above the 1981-2010 average September was the second warmest on record to that of 2006.
So very mild with night-time minima significantly above average, showing a departure of over 2° from the norm'. Both the 6-7th and 12-15th saw a feed of warm air from the south that resulted in temperatures well above the 20°c mark (24.7°c on the 15th) and which culminated in a sharp thunderstorm on the 13th.
However, the month started and finished unsettled and whilst rainfall was never that heavy or prolonged, it was frequent.
It will not be very often that you will say that the driest month of the year was ... October totalling just 23.9 mm.
Indeed it was a fine month with high pressure dominant for significant lengthy periods and hence it was extremely dry with the temperature very marginally above average.
For much of the time the high pressure was centred over Scandinavia, bringing easterly winds, but with Cumbria generally sheltered from any showers and subsequently enjoying plenty of sunshine. It became slightly unsettled at mid-month after which high pressure once again became dominant.
MSLP of 1023.3 Mb was +12.4 Mb above the local average, a significant departure from the norm' and further evidence of just how dominant and prolonged the spells of high pressure were. Consequently rainfall was insignificant, never heavy nor prolonged, albeit from mid month especially and under cloudier skies, there were occasional very light showers/spells of rain.
November was almost perfect - cold, wintry at times, below average rainfall with above average sunshine and was a fine autumnal month. It even had the coldest temperature of the year as well, -5.7°c on the 26th.
This is how the last month of autumn should be and whilst it was much colder than average with overnight frosts both common and hard at times, it was also much drier than average. Despite some wintry weather, there were a good number of decent sunny days, especially the 1st-2nd and then 23rd-26th, the latter in particular being quite glorious.
The 2cms of snow that lay on the ground of the morning of the 9th is the earliest such date to record a 'day of laying snow' at this site. Rain on 20 days during the month may seem slightly high, but two of those were just from a large accumulation of frost (melted) and the rain/snow that we did have was never that significant, at its heaviest during the 16-18th.
The final week of the month saw the sun shine that little bit more and was when the frosts were are their hardest.
Subsequently at 3.64°c the temperature was 2.3°c below the 1981-2010 average and it was the coldest November (of 8) yet recorded at this site.
AUTUMN
It must be said that this autumn Was quite agreeable. September was unduly warm, yet November was equally as cold with October virtually average. Rainfall was notably less than average, October being especially dry and only September was wetter than average.
Maulds Meaburn recorded 200.6 mm of rain (Crosby Ravensworth 225.2 mm) the driest since 2007 and is the 2nd driest of the ten now recorded.
At Newton Rigg rainfall totalled 218.4 mm and had a mean temperature of 9.02°c. In comparison to the 1981-2010 averages this represented 77.1 % of autumn rainfall and it was 0.1°c colder than average.
This makes the autumn of 2016 the 33rd driest in a series back to 1900 (2 yrs of missing data) and with 28 having been colder, 31 warmer and 4 having the same mean temperature in a series back to 1953.
The year finished on a quiet note with December being mild with a distinct lack of wintry weather, often dull, but with below average rainfall of 75.3 mm.
A mean temperature of 5.86°c was well above average by 2.5°c and apart from a very wet day on the 23rd, rainfall during the rest of the month tended to be patchy and light, with the month having both a dry start and end, it being the driest December since 2010.
MSLP of 1023.3 Mb was a notable +11.2 Mb above the local average high pressure frequent during the month, especially at both ends and it was also the first December (of 8) in my records in which pressure has failed to drop below 1000 Mb during the entire month.
The following is the monthly breakdown of the weather at Shap during 2016.
OTHER - Maulds Meaburn data:
� A Mean Minimum of 5.11°c - Mean Maximum of 12.68°c
� During 2016 snow lay on the ground* on 5 days and was seen to fall on 29 (inc' sleet) with hail falling on 8 days.
� Fog* was recorded on 2 days with thunder heard on 6 days.
� Mean cloud* cover was 80.1% with 134 days having a 100% cover* and 5 days being totally clear.
� Mean air pressure* was 1014.6 Mb (+1.3 MB above the local average) - Lowest pressure was 968.2 Mb (10th Jan' and 8th Feb') and the highest was 1042.1 Mb (27+28th Dec').
� Mean wind speed* was 6.70 Mph - the highest gust = 63 Mph (1st Feb') - the windiest day with a mean speed of 28.0 Mph was also the 1st Feb'.
� Gales (a 10 min' mean wind speed of 39 Mph) were recorded on just 1 day.
� We had 61 air frosts (2.3 above average) - 122 ground frosts (4.5 above average) - with 36 days attaining 20°c+ (3 attaining 25°c) and no Ice days when the temperature remained below freezing all day.
� The 30 cm soil temperature had a mean of 10.2°c with a low of 2.5°c (18th Jan') and a high of 18.0°c (20-23rd July).
� The 100 cm soil temperature had a mean of 10.1°c with a low of 5.4°c (21st and 29th Feb') and a high of 14.8°c (27th Aug' and 10th Sept').
� * Refers to 0900 GMT � the hour of observations.
� Met' office data is still provisional for August onwards.
� THANKS:- There are several people whom I would like to thank for their help, support and assistance over the past year: For the supplying of data: to Susan Sandelands and Martin Wilson of the Hydrometry and Telemetry team at the Environment Agency (superbly efficient). And then to a my deputy observers who stand in for me when required, Alan and especially Sarah.
        ------------------------------------------------------------------------------------------------------------------------------

                                  * 2016                 TEMP'     8.89°c         --          RAIN    1072.1 mm
                                  * 2015                 TEMP'     8.75°c         --          RAIN    1663.8 mm
                                  * 2014                 TEMP'     9.58°c         --          RAIN    1343.8 mm
                                  * 2013                 TEMP'     8.49°c         --          RAIN    1232.1 mm
                                  * 2012                 TEMP'     8.26°c         --          RAIN    1415.9 mm
                                  * 2011                 TEMP'     9.17°c         --          RAIN    1305.4 mm
                                  * 2010                 TEMP'     7.42°c         --          RAIN     702.9 mm
                                  * 2009                 TEMP'     8.86°c         --          RAIN    1264.5 mm
                                  * 2008                 TEMP'                    --          RAIN    1381.3 mm
JANUARY 2010
FEBRUARY 2010
MARCH 2010
APRIL 2010
MAY 2010
JUNE 2010
JULY 2010
AUGUST 2010
SEPTEMBER 2010
OCTOBER 2010
NOVEMBER 2010
DECEMBER 2010
JANUARY 2011
FEBRUARY 2011
MARCH 2011
APRIL 2011
MAY 2011
JUNE 2011
JULY 2011
AUGUST 2011
SEPTEMBER 2011
OCTOBER 2011
NOVEMBER 2011
DECEMBER 2011
JANUARY 2012
FEBRUARY 2012
MARCH 2012
APRIL 2012
MAY 2012
JUNE 2012
JULY 2012
AUGUST 2012
SEPTEMBER 2012
OCTOBER 2012
NOVEMBER 2012
DECEMBER 2012
SUMMER 2012
REVIEW OF 2012
JANUARY 2013
FEBRUARY 2013
MARCH 2013
APRIL 2013
MAY 2013
JUNE 2013
JULY 2013
AUGUST 2013
SEPTEMBER 2013
OCTOBER 2013
NOVEMBER 2013
DECEMBER 2013
REVIEW OF 2013
JANUARY 2014
FEBRUARY 2014
MARCH 2014
APRIL 2014
MAY 2014
JUNE 2014
JULY 2014
AUGUST 2014
SEPTEMBER 2014
OCTOBER 2014
NOVEMBER 2014
DECEMBER 2014
WINTER 2014
REVIEW OF 2014
JANUARY 2015
FEBRUARY 2015
MARCH 2015
APRIL 2015
MAY 2015
JUNE 2015
JULY 2015
AUGUST 2015
SEPTEMBER 2015
OCTOBER 2015
NOVEMBER 2015
DECEMBER 2015
REVIEW OF 2015
JANUARY 2016
FEBRUARY 2016
MARCH 2016
APRIL 2016
MAY 2016
JUNE 2016
JULY 2016
AUGUST 2016
SEPTEMBER 2016
OCTOBER 2016
NOVEMBER 2016
DECEMBER 2016
OTHER ARTICLES
The Oldest Inhabitant
An Inch Of Scotch Mist
© Darren Rogers 2010-17
Want to comment on this site? email