
ADDITIONS MADE:
24.01.23. - Now includes the 2021 and 2022 rainfall data.
06.02.21. - Now includes the 2020 rainfall data.
18.01.20. - Now includes the 2019 rainfall data.
08.01.19. - Now includes the 2018 rainfall data.
21.01.18. - Now includes the 2017 rainfall data.
25.01.17. - Newspaper articles concerning flooding in 1856 and 1861.
06.01.17. - Now includes the 2016 rainfall data.
27.01.15. - Now includes the 2015 rainfall data along with the daily totals for the 'Desmond' event of 4-6th December.
10.06.15. - Discovered an entry for Orton in the Met' Office's 'Monthly Weather Report' for January 1925
29.01.14. - Now updated with the rainfall records for 2013-14
08.03.13. - Rainfall records for the period 1967-2012 - all monthly and annual records, averages, droughts and days of excessive rain.
14.10.12. - New Chapters for Orton and Ravenstonedale
Orton is a charming village set in beautiful rolling countryside at the foot of Orton Scar in the upper Lune Valley and which is on the route of the coast to coast walk. Just a few miles north, over the scar is the Eden valley and the village of Crosby Ravensworth. In those few miles the increase in rainfall experienced at Orton is notable and which continues to increase just a mile away at Tebay.
From chocolate to possibly the finest view in Cumbria (to be found above Orton on the Appleby road and looking down on the village and the Howgill Fells beyond), Orton is just another delight and must see place in our little bit of Cumbria.
Orton intrigues me - the rainfall figures that I have for the village demonstrate it to be much wetter than back over the hill at Crosby Ravensworth. Yet when Orton is compared with Ravenstonedale it is also much wetter, (with rainfall in Ravenstonedale more comparable to that of Crosby Ravensworth) and this has been the case over a prolonged period of time.
Unfortunately I have not been able to locate any of the records for Orton or Ravenstonedale in any of the archives and as with the majority of what I have found to date, rainfall dominates.
Before anyone in the village was recording the weather there was always the local newspapers from which to learn of any significant event - the following are some of what I have found to date:
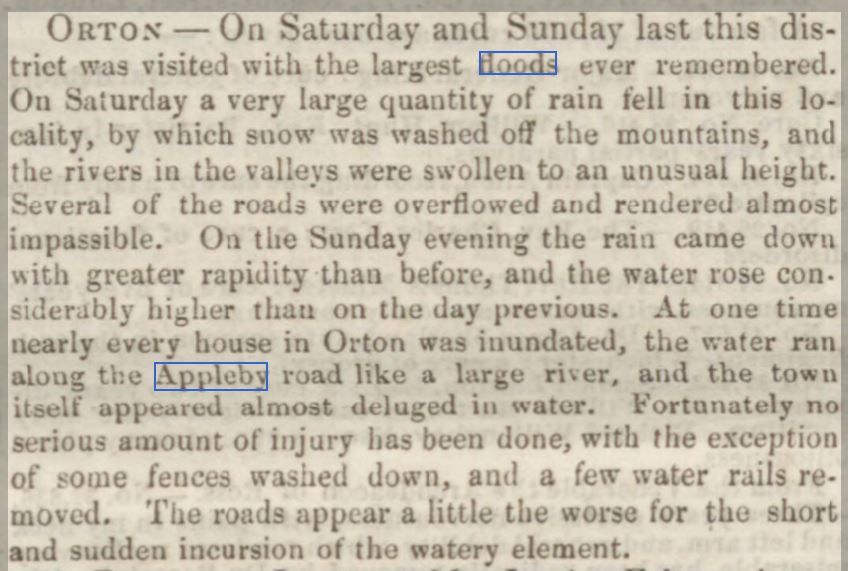
1856 - December - This account taken from the Westmorland Gazette sounds very dramatic and was part of widespread flooding that locally was the worst since 1822.
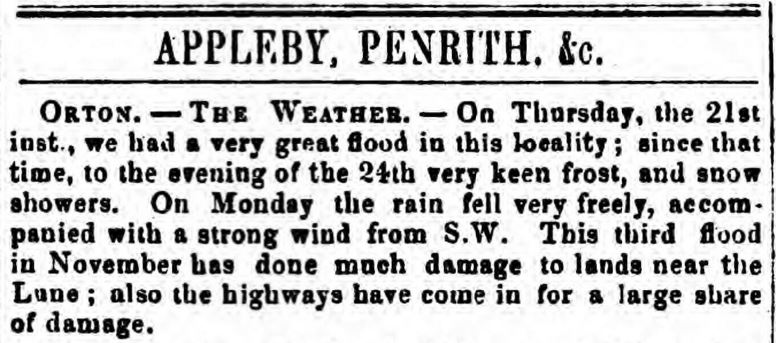
1861 - November - This account is from the Kendal Mercury (30th Nov') of flooding in the village and makes reference to three flooding events during the month!
Recording of rainfall commenced with the Reverend E. Holme (View image) in 1883 at the vicarage. The Reverend had previously been at Tebay, where he recorded rainfall for the period 1880-82 and he must have taken his rain gauge with him and he even kept it at the same height, 3ft 6", above the ground as he had used at Tebay. The gauge remained at that height of 3ft 6" in every year, until curiously in the final year, 1901, for which rainfall was recorded, it is shown as being 7ft above the ground.
I can find no reason as to why this change suddenly occurred, but it is curious and I wonder just how and why he put it that high.
Making a comparison with the site at Ravenstonedale (Brownber), this did make a difference, as whilst Orton still recorded more rainfall during the year, the percentage difference was now reduced between the two sites.
Alas I have been unable to trace the Reverend's records to any archive and he also did not have any entries in the Rainfall Guides regarding the days, months or years. I have no reason to doubt the annual rainfall totals of Rev. Holme and they compare quite well with those of Michael Scott (see below) and the difference in the averages between the two could in part be explained by the over-exposure (greater height above the ground) employed by Holme to that of Scott who had his gauge set at the correct height of 1ft.
But I do have a problem with the number of rain days that Holme records as it is simply too few, he averages 43.5 days a year fewer than Scott, whom I think with an average of 227.2 days of rain a year is spot on.
Just to prove this point, between 1883 and 1886 Holme recorded less days of rain than the site at Ravenstonedale despite recording a far greater fall of rain, eg: 1886 Ravenstonedale had 52.07" of rain on 185 days, whereas Holme recorded 66.14" of rain on just 133 days! But after 1886 Holme did make improvements in this respect.
| INCHES MM's RAIN DAYS |
Again there appears to be no entries in the rainfall Guides regarding the days, months or years, so as with Rev. Holme, all that we do have are annual totals.
But the figures provided by Scott totally corroborate those of Rev. Holme and it is Scott's figures that I believe are totally beyond reproach and demonstrate that Orton is that bit wetter than other nearby villages.
Taking the years 1915-1919 when there was also a gauge at Ravenstonedale, we find that Orton averaged 57.186" to that of 49.362" at Ravenstonedale. In those same five years Morland only averaged 35.758"!
| INCHES MM's RAIN DAYS |
If we applied an average for the combined total of 30 years from both Holme and Scott it would be 56.91" (1445.5 mm) falling on 200 days.
MET' OFFICE - 'Monthly Weather Report' - January 1925
It was somewhat surprising to find an entry for Orton in one of the Met' Office's monthly weather reports, but nonetheless, there it was and Orton was the wettest location in England on New Year's Day 1925 with a fall of 51.0 mm.
1967 - to date (John Falshaw)
Originally when compiling the Orton chapter I said "It would have been nice to have had something more recent from Orton as well" and I suggested that by using both sets of figures shown above that Orton is approximately 10-12" (254-304 mm) wetter each year than Maulds Meaburn. Well there is something more recent - try a record that is now 50 years long, from 1967 to 2016 and just as importantly, the record continues.
From an enquiry that I sent to the Orton history group (still not answered my original enquiry for any information on Rev. Holme or Mr. Scott) the reply that I did receive mentioned a Mr. John Falshaw of Shallowford who had kept weather records for some time. A quick search of the Met' Office archives did indeed show such a record and I was then able to speak with John in person.
And what a lovely chap, the ex head teacher of the village primary, like myself a sworn Yorkshire Man and a devout follower of Yorkshire CCC. He kindly invited me over and the rainfall records back to 1967 are just a treasure trove of information.
John retired from doing the daily rainfall readings at the end of 2012, but the site is being continued by the Environment Agency with monthly read gauges and so the record will be maintained. Usually once people such as John retire the record is discontinued so credit must go to the EA for continuing it and in this age of automatic weather stations it is hard to envisage that one person will make 46 years of continuous records from the same site, it is a remarkable achievement.
So what of the record, with so much to analyse where do you start! What is even more valuable to myself is that from 1981 John was registered as an official Met' Office site and has provided me with the full daily register of every year since.
To make a start, below is listed all the monthly rainfall records from 1967 to 2019 with the various averages at the bottom.
But straight away my attention was drawn to the years from 2007 as this is when my own records commenced - a direct comparison - did my estimate above hold up? See below.
WETTEST AND DRIEST YEARS
We can interpret these years by applying the following standards:
'Very Dry' years showing a departure from the average of more than 25% (less) numbers six - the years 1969, 1971, 1973, 1996, 2001 and 2010 fall into this bracket and equals 10.7%
'Dry' years being 10-25% less rainfall than average - numbers six, being: 1970, 1975, 1984, 1995, 2003 and 2018, being 10.7%
'Average' years being +/- 10% of the average - obviously by far the greatest number (28), 1968, 1972, 1974, 1976, 1979-83, 1985-1993, 1997, 2004-05, 2013-14, 2016-17, 2019 and 2021-22 - equals 50.0%
'Wet' Years being 10-15% more than the average - its sum (12) equals that of the very dry and dry years combined with, 1967, 1977-78, 1994, 1998-99, 2002, 2006-09 and 2011-12 - equals 21.4%
'Very Wet' years showing a departure from the average of more than 25% (greater) - has just the four years, 2000, 2011, 2015 and 2020, when possibly more might have been expected - equals 7.1%.
DROUGHTS
The periods of drought from 1981 are shown below. Absolute droughts far outweigh the number of partial droughts, thus demonstrating the rarity of 29 successive settled days, at least in Orton.
1.) ABSOLUTE DROUGHT - Period of at least 15 consecutive days to none of which is credited 0.2mm (0.01 inch) of ppt
2.) PARTIAL DROUGHT - Period of at least 29 consecutive days whose mean daily ppt does not exceed 0.2mm
DAYS OF EXCESSIVE RAIN
Since 1981 the days that really stick out are those on which 100 mm or more of rain fell and they are:
Anyway to compare Maulds Meaburn with Orton over the last 11 years:
As the main bands of rain arrive on south westerly winds and Orton lies to our SSW, it will have more rain than ourselves. Also Crosby Ravensworth fell and the eastern Lake District have a degree of 'rain shadow' from the south west and which becomes more marked north of Maulds Meaburn.
Orton’s mean 54yr rainfall for 1967-2022 is 1596.9 mm / 62.87 In (1967 – 2020 is 1594.7 mm / 62.78 inch) – which is a very good comparison to the 11 yr period of Scott (1915-25) when the mean was 60.7 inch – a comparison that has widened over recent years due to the relatively wetter years of the 21st century.
++ using Google maps it is 4.83 miles from rain gauge to rain gauge - which quite amazingly equates to a reduction of 108.1 mm of rain per mile.
RANDOM YEARLY COMPARISONS
Taking a few random years from the rainfall guides and trying to use Maulds Meaburn/Crosby Ravensworth as a central point we find some interesting points:
1883 - Reagill recorded 48.25 inches of rain, other nearby figures are: Shap (Sleddale) 86.00" - Shap (Copy Hill) 65.27" - Appleby 37.49" - Orton 62.42" - Ravenstonedale 47.14"
1885 - Reagill recorded 38.89 inches of rain, other nearby figures are: Shap (Sleddale) 81.45" - Shap (Copy Hill) 57.23" - Appleby 25.28" - Orton 54.62" - Ravenstonedale 37.04"
1889 - Reagill recorded 30.06 inches of rain, other nearby figures are: Shap (Sleddale) 52.20" - Shap (Copy Hill) 39.55" - Appleby 27.71" - Orton 39.68" - Ravenstonedale 31.83"
© Darren Rogers 2023
Want to comment on this site or do you have any information that you would like to see included on this page? Please contact - email
         Jan     Feb     Mar     Apr     May    June    July    Aug     Sept     Oct    Nov     Dec     YEAR

1967	 87.9	238.3	164.6	 40.9	165.9	145.8	147.8	127.5	177.0	436.4	103.1	113.0	1948.2
1968	122.2	 39.4	275.8	111.8	 87.1	 80.5	 73.7	 56.6	252.0	168.4	111.8	 71.9	1451.2
1969	116.1	 64.3	 40.1	 87.6	 95.0	 69.6	 74.4	 66.0	119.1	 62.0	202.2	135.4	1131.8

1970	130.6	152.9	 55.6	170.9	 17.3	 46.2	 88.4	 90.4	192.0	157.2	186.4	 91.7	1379.6
1971	105.4	109.0	 62.2	 19.1	 67.6	 66.3	 71.4	189.2	 34.3	164.1	118.1	 52.6	1059.3
1972	148.8	107.2	101.3	155.2	148.3	205.2	111.3	147.6	 22.6	 57.7	245.1	275.1	1725.4
1973	104.9	 72.6	 77.5	118.9	 81.3	 34.0	 94.0	144.0	 76.4	 52.1	 87.1	121.7	1064.5
1974	286.8	153.1	 83.8	  3.0	 41.9	 39.4	139.8	 94.2	161.8	 74.1	237.7	329.7	1645.3
1975	318.0	 47.3	 61.3	119.4	 54.9	 60.1	114.4	 99.0	242.4	 71.7	113.5	 46.1	1348.1
1976	196.6	126.2	 99.7	 80.3	127.2	 51.1	 76.4	 29.2	132.6	227.5	188.5	 97.7	1433.0
1977	132.0	108.8	150.0	166.0	 56.0	 90.1	 69.3	104.3	194.8	217.0	316.9	233.2	1838.4
1978	257.9	148.0	229.3	 29.5	 17.0	 86.5	109.3	149.2	148.4	 70.6	406.7	139.0	1791.4
1979	 62.2	 46.3	255.3	 72.3	113.4	 79.0	 42.7	121.0	105.9	 93.0	291.6	284.2	1566.9

1980	 88.8	131.6	 95.0	 10.7	 36.6	158.6	 96.3	159.7	139.7	215.5	292.7	300.6	1725.8
1981	 85.3	 87.5	269.5	 39.2	 82.0	103.8	 67.7	 32.8	275.9	202.2	215.3	 55.2	1516.4
1982	179.1	149.4	190.3	 19.1	108.4	136.8	 57.9	129.1	 99.5	152.6	268.6	232.1	1722.9
1983	283.7	 50.3	150.9	 66.8	133.8  	 61.3	 65.0	 29.1	119.3	252.8	 66.4	189.4	1468.8
1984	217.3	 75.3	 49.9	 31.2	 20.6	 63.6	 21.0	 77.5	169.4	189.5	266.5	141.0	1322.8
1985	 67.0	 16.7	 90.7	117.6	 85.3	 55.7	164.8	266.9	150.1	 85.6	110.1	321.4	1531.9
1986	192.2	  9.9	158.4	 72.1	178.9	 56.0	 66.0	119.6	 21.4	201.3	246.9	317.6	1640.3
1987	 52.8	102.0	159.7	 72.9	 47.1	167.7	110.1	 93.8	172.2	213.3	122.5	198.1	1512.2
1988	227.8	142.3	120.5	 59.5	 70.7	 17.2	226.1	130.0	132.8	148.5	 84.3	157.7	1517.4
1989	126.4	281.5	263.4	 75.8	 29.6	 48.5	 22.6	145.0 	 26.9	180.1	129.9	104.4	1434.1

1990	365.7	399.4	 71.4	 54.3	 68.8	 88.8	 73.7	 51.3	 59.6	190.8	 66.4	228.7	1718.9
1991	167.6	191.5	167.0	 95.8	  8.6	129.3	 50.0	 49.2	 83.5	167.0	238.3	127.6	1475.4
1992	 51.9	138.4	149.0	 90.5	 75.3	 39.8	111.3	162.1	129.0	107.1	237.5	164.7	1456.6
1993	319.5	 14.9	 62.9	143.7	170.7	 48.1	 85.1	 68.0	 72.3	 53.5	 72.1	318.4	1429.2
1994	219.9	 94.8	297.0	140.6	 50.1	 85.8	 54.9	148.8	109.8	 86.6	176.6	358.3	1823.2
1995	288.5	294.5	107.4	 17.0	 63.0	 44.0	 95.9	 15.3	 87.9	209.3	105.4	 44.1	1372.3
1996	 77.5	119.5	 30.8	 73.7	 67.6	 38.7	 58.7	 73.2	 91.1	176.1	155.2	 55.5	1017.6
1997	 18.4	490.8	121.1	 24.5	133.6	115.8	 57.4	 57.4	106.6	 59.5	106.7	200.4	1492.2
1998	198.5	130.9	175.4	105.1	 50.1	172.2	145.6	 85.5	 84.6	298.0	160.0	168.2	1774.1
1999	383.9	 63.9	119.2	124.1	134.0	 79.1	 45.4	 75.6	151.8	116.4	140.7	315.2	1749.3

2000	258.5	229.0	 88.0	110.8	 64.3	106.3	 95.1	 84.6	235.0	287.7	246.5	237.6	2043.4
2001	 84.5	160.4	 63.8	109.7	 26.3	 56.3	 78.6	 88.2	134.5	159.2	128.4	 86.0	1175.9
2002	267.7	342.6	 97.9	 91.1	175.0	122.6	 87.6	119.6	 54.8	171.4	148.2	147.4	1825.9
2003	132.0	 69.2	115.3	 73.0	128.1	 80.1	119.4	 22.9	123.0	 38.1	177.3	172.9	1251.3
2004	221.0	169.5	137.8	 71.8	 63.6	 95.4	 59.7	263.0	200.7	210.5	 51.9	173.6	1718.5
2005	330.8	 60.8	 92.6	106.3	 90.3	 49.4	 47.5	124.5	149.2	195.3	152.9	 61.5	1461.1
2006	135.2	 93.5	167.2	 76.9	128.7	 57.6	 51.3	127.3	120.1	171.0	225.2	428.1	1782.1
2007	320.9	104.5	104.2	 87.1	107.3	174.4	170.5	 90.9	103.9	 87.5	112.3	286.6	1750.1
2008	323.8	175.3	172.4	 68.8	 23.8	141.6	116.8	186.5	147.3	365.0	120.8	131.8	1973.9
2009	303.7	 26.6	 93.7	 63.1	123.7	 59.8	210.2	208.3 	 52.2	139.7	504.4	149.4	1934.8

2010	 78.6	 37.3	130.0	 41.2	 31.9	 31.7	224.3	 86.9	122.9	147.1	202.1	 33.6	1167.6
2011	236.2	278.0	113.4	 98.0	166.3	 60.2	104.3	133.7	213.1	151.3	150.3	274.7	1979.5
2012	140.7	111.2	 38.5	112.9	141.3	190.9	106.2	164.7	210.3	164.2	240.4	288.8	1910.1
2013	157.6	 56.0	 62.8	101.6	 97.2	 57.0	162.0	180.8	 94.8	224.2	 98.4	313.8	1606.2
2014	230.0	281.6	135.2	 81.2	103.6	 43.6	 77.2	154.2	  8.4	242.6	109.0	219.0	1685.6
2015	280.2	146.2	161.4	 65.0	162.6	 44.2	114.8	125.2	 36.0	 82.8	385.4	704.0	2307.8
2016	266.4	204.8	 69.4	125.6	 42.0	121.0	108.8	190.2	138.8	 41.2	120.4	129.0	1557.6
2017     79.0	161.0	176.0	 21.4	 78.0	162.2	169.6	106.0	192.2	218.2	141.2	144.2	1649.0
2018    213.4    97.0    86.2    82.4    52.6    68.0    52.2    95.6   172.0   148.0   188.2   142.2   1398.0
2019	 51.2	160.4*	254.0*	 53.4	 42.0	134.2	113.4	210.0	184.2	121.2	113.6	203.0	1640.6
2020	257.0*	469.8	147.6	 17.8	 58.0	183.6	126.3*	220.0	 78.6	217.0	212.4	220.4	2208.5
2021	187.4	234.0	297.0	 13.0	156.8	 22.4	 77.4	 74.2	 75.8	307.0	107.2	148.6	1700.8
2022	 92.8	294.2	 55.0	 53.2	 98.0	 69.2	 92.6	 53.2	113.0*	275.0*	235.0*	180.8	1612.0

MEAN    184.5	149.3	131.5	 77.4	 86.6	 87.4	 97.4	116.0	126.8	166.5	179.3	194.1	1596.9

Highest	383.9	490.8	297.0	170.9	178.9	205.2	226.1	266.9	275.9	436.4	504.4	704.0	2307.8
 Lowest	 18.4	  9.9	 30.8	  3.0	  8.6	 17.2	 21.0	 15.3	  8.4	 38.1	 51.9	 33.6	1017.6

* = estimated by the Met Office due to a faulty gauge


      TOP 12 WET MONTH'S			TOP 11 DRY MONTH'S		TOP 12 WET YEARS	TOP 10 DRY YEARS

1	704.0	Dec-15				3.0	Apr-74			2307.8	2015		1017.6	1996
2	504.4	Nov-09				8.4	Sep-14			2204.6	2020		1059.3	1971
3	490.8	Feb-97				8.6	May-91			2043.4	2000		1064.5	1973
4	469.8	Feb-20				9.9	Feb-86			1979.5	2011		1131.8	1969
5	436.4	Oct-67				10.7	Apr-80			1973.9	2008		1167.6	2010
6	428.1	Dec-06				14.9	Feb-93			1948.2	1967		1175.9	2001
7	406.7	Nov-78				15.3	Aug-95			1934.8	2009		1251.3	2003
8	399.4	Feb-90				17.0	Apr-95			1910.1	2012		1322.8	1984
9	383.9	Jan-99					May-75			1838.4	1977		1348.1	1975
10	365.7	Jan-90				17.2	Jun-85			1825.9	2002		1372.3	1995
11	358.3	Dec-94				17.8	Apr-20			1823.2	1994
12	342.6	Feb-02								1791.4	1978
The decadal averages also prove quite revealing:
         Jan     Feb     Mar      Apr     May    June    July    Aug     Sept    Oct     Nov     Dec     YEAR

1970	174.3	107.1	117.6	 93.5	 72.5	 75.8	 91.7	116.8	131.1	118.5	219.2	167.1	1485.2
1980	152.0	104.7	154.8	 56.5	 79.3	 86.9	 89.8	118.4	130.7	184.1	180.3	201.8	1539.3
1990	209.1	193.9	130.1	 86.9	 82.2	 84.2	 77.8	 78.6	 97.6	146.4	145.9	198.1	1530.9
2000	237.8	143.1	113.3	 85.9	 93.1	 94.4	103.7	131.6	132.1	182.5	186.8	187.5	1691.7
2010	173.3	153.4	122.7	 78.3	 91.8	 91.3	123.3	144.7	137.3	154.1	174.9	245.3	1690.2
C20th	172.2	133.3	136.5	 79.1	 81.4	 83.8	 87.5	102.7	125.5	156.3	177.9	181.5	1517.7
C21st	202.1	172.3	124.3	 75.0	 94.0	 92.7	111.6	135.2	128.7	181.1	181.4	212.1	1710.4
Then the decadal seasonal averages are just as interesting, spring as hardly altered throughout the 40 years, but the others decades have fluctuated more widely.
Winter	70's	448.5		Spring	70's	283.6		Summer	70's	284.3		Autumn	70's	468.8
	80's	458.5			80's	290.6			80's	295.0			80's	495.2
	90's	601.1			90's	299.2			90's	240.6			90's	389.9
	00's	568.4			00's	292.3			00's	329.6			00's	501.4
        10's	572.0			10's	292.7			10's	359.3			10's	466.3
       C20th	487.0		       C20th	297.1		       C20th	274.0		       C20th	459.7
       C21st	586.5		       C21st	293.3		       C21st	339.5		       C21st	491.2
1.) ABSOLUTE DROUGHT - 06.04.20. - 22.04.20. 17 Days of no recordable rain
22.06.18. - 11.07.18. 20 Days " " " "
18.03.12. - 01.04.12. 15 Days " " " "
12.05.08. - 26.05.08. 15 Days " " " "
03.04.07. - 18.04.07. 16 Days " " " "
21.05.97. - 04.06.97. 15 Days " " " "
25.04.95. - 11.05.95. 17 Days " " " "
21.06.95. - 05.07.95. 15 Days " " " "
06.06.92. - 29.06.92. 24 Days " " " "
28.08.91. - 12.09.91. 16 Days " " " "
19.11.89. - 05.12.89. 17 Days " " " "
04.06.88. - 20.06.88. 17 Days " " " "
06.09.86. - 26.09.86. 21 Days " " " "
11.10.85. - 29.10.85. 19 Days " " " "
08.08.84. - 27.08.84. 20 Days " " " "
26.07.83. - 14.08.83. 20 Days " " " "
09.04.82. - 27.04.82. 19 Days " " " "
16.07.82. - 30.07.82. 15 Days " " " "
23.08.81. - 06.09.81. 15 Days " " " "
2.) PARTIAL DROUGHT - 10.09.02. - 10.10.02. 31 Days - 4.3 mm
12.11.89. - 12.12.89. 31 Days - 4.3 mm
03.09.86. - 05.10.86. 33 Days - 4.3 mm
                           20.12.1985 - 112.2 mm = 7.3%  of the yearly fall

                           05.01.1999 - 100.9 mm = 5.8%  "  "    "     "

                           07.01.2005 - 114.0 mm = 7.8%  "   "   "     "

                           05.12.2015 - 137.6 mm = 5.96% "  "    "     "
The 'Desmond' event of 4-6th December 2015 saw 95.2 mm recorded on the 4th and with that 137.6 mm then falling on the 5th, gave a 48hr total of 232.8 mm.
Meaburn 0.2 mm 1.0 Orton 0.2 mm 1.0
2008 1381.3 227 174 1973.9 240 195
2009 1264.5 224 163 1934.8 235 179
2010 702.9 195 124 1167.6 207 142
2011 1305.4 230 179 1979.5 241 198
2012 1415.9 222 174 1910.1 223 179
2013 1232.1 191 154 1606.2
2014 1343.8 227 176 1685.6
2015 1663.8 225 176 2307.8
2016 1072.1 214 153 1557.6
2017 1096.7 226 165 1649.0 254 188
2018 1077.0 205 153 1398.0
2019 1231.0 221 158 1640.6
2020 1582.1 226 186 2208.5
2021 1168.9 200 145 1700.8
2022 1193.3 211 166 1612.0
MEAN 1243.5 215 161 1765.8 233 153
So (and still with [after 2022]) a difference of 20.56 inches per year, I was out by virtually 100%!! Albeit I can take some solace in that the decadal averages show a marked increase since 2000 and I was comparing back to rainfall of 90 years ago (sounds a good excuse!), but it certainly demonstrates just how much wetter it is at Orton, even though it is only 5 miles away++.