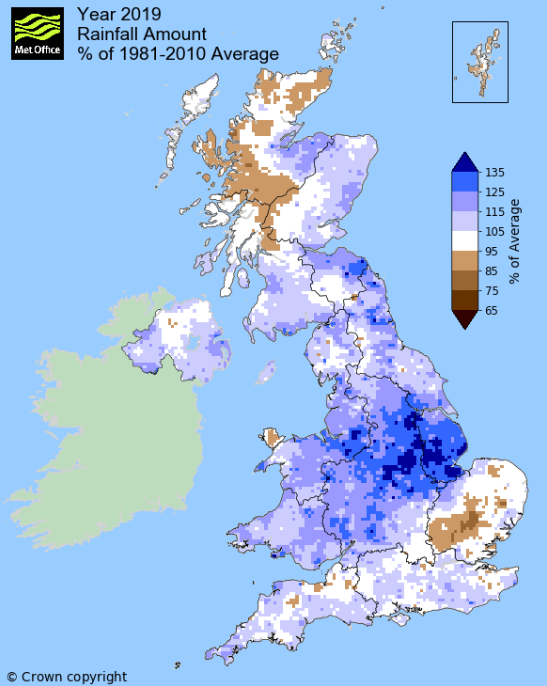
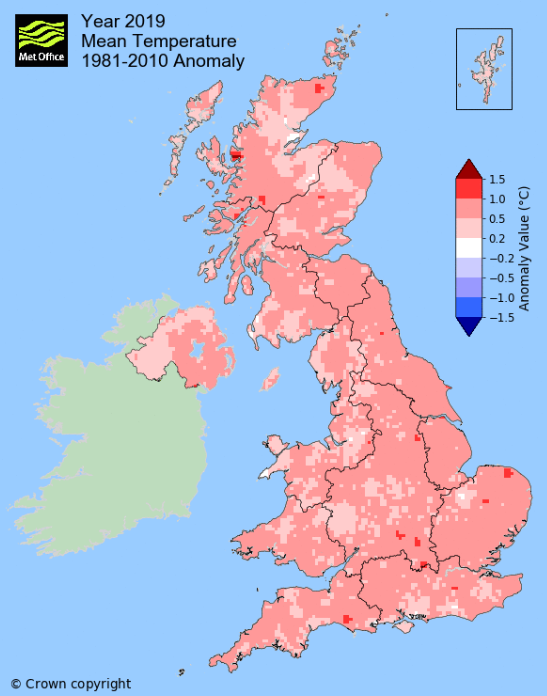
Slightly warmer than average with rainfall very close to average - one notable hot spell Overall a quiet year, but with a poor summer and the final seven months all exceeding 100 mm of rain.
For the first five months of the year the rainfall total was running a deficit, but then June started a poor summer and every month thereafter notched up at least 100mm. Whilst June to September were all wetter than average, the final three months were, despite having over 100 mm of rain, drier than normal.
Quite widely across the county, the winter was the driest season in 2019 - slight more common than one would imagine. In a record back to 1856, Appleby-In-Westmorland has now seen this happen on twenty occasions (7 times during 1857-1899, 11 times in the 20th century and this is the second time this century).
It was broadly a 'Wet Year' (between 110-125% of average) across Cumbria with some locations managing to exceed 110% of their average. Seathwaite, Warcop and Appleby were just either side of 117%, although at Newton Rigg it was as high as 124%, yet at Shap it was down at 106.6%.
As for temperature, it was slightly warmer than average, typically in the area of +0.4°c.
Whilst May and June were colder than average it was only really the fact that the three months of September to November (the latter two months especially) were colder than average that ensured the final mean temperature did not venture too much above average.
The summer never really experienced any sustained period of heat, but the three days of 23rd to 25th July saw a sudden explosion of warmth that peaked with temperatures widely over 30°c across Cumbria (even at Shap), Carlisle the highest at 32.2°c (90.0°f).
In Cumbria it has provisionally been the coldest and wettest year since 2015 albeit with slight variations at a few sites (eg: wettest at Seathwaite since 2017, coldest since 2017 at Newton Rigg).
TEMPERATURE
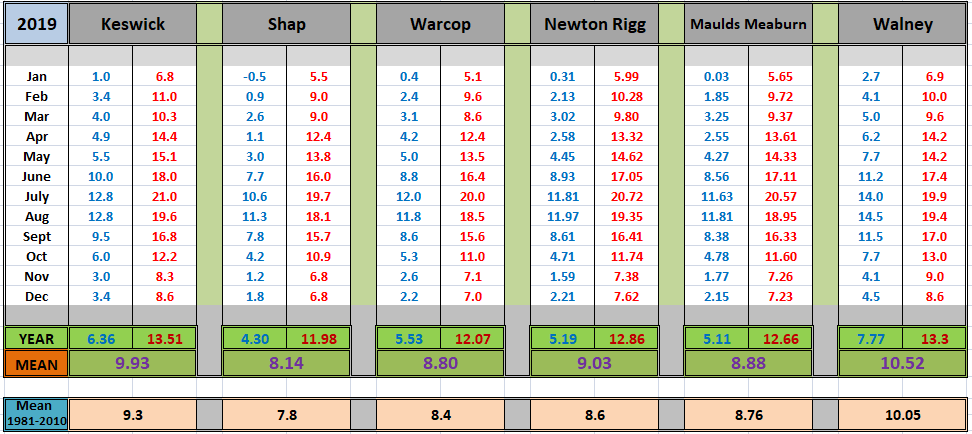
Locally all sites were warmer than average during 2019, ranging from just +0.1°c at Brampton to 0.6°c at Keswick.
Yet again this has seen Keswick, for at least the sixth year in succession, once again being just that little bit more above average than everywhere else - it will now become interesting to see how Keswick fares in a colder than average year, should we get one!
With a mean temperature of 9.03°c (mean minimum of 5.19°c and mean maximum of 12.86°c) at Newton Rigg, 2019 becomes the 14th warmest in a complete series back to 1957. That 9.03°c being 0.4°c above the 1981-2010 mean.
Staying at Newton Rigg, six months were warmer than average during the year, with five being colder and one having the same mean temperature.
There was only the one month that finished either above or below the average by more than 1.5°c and this was an exceptionally warm February that was 2.6°c warmer than average.
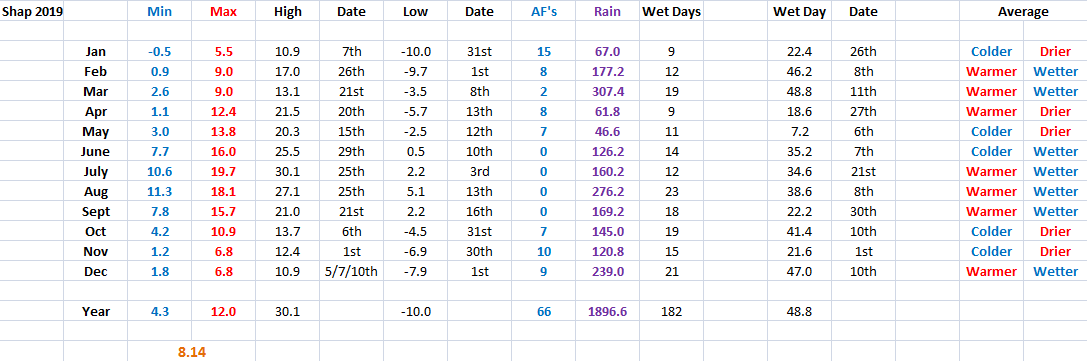
At the Met' Office site at Shap 66 air frosts were recorded during 2019, its average being 74.5 and which had an annual mean temperature of 8.14°c (0.3°c above average).
Cumbria maintained its wide spread of temperatures, the warmest and coldest sites having a margin of over 2.0°c and this saw Walney finish with a mean temperature of 10.52°c and Spadeadam at just 8.0°c
Here at Maulds Meaburn a mean temperature of 8.88°c (mean minimum of 5.11°c and maximum of 12.66°c) was 0.12°c above the average for my short period of records for (2009-2018), but which is very much in keeping with the picture throughout Cumbria.
The highest and lowest temperatures recorded at a standard site during 2019 were: a maximum of 32.2°c (25th July at Carlisle) and a minimum (excluding Great Dunn Fell) of -10.0°c (31st January and like 2017 and 2018, at Shap).
Here at Maulds Meaburn it was: 31.7°c (89.1°f) 25th July and -8.2°c (17.2°f) on the 3rd February.
We had just the one 'Ice Day' (when the temperature remains below freezing for the 24hr period) during 2019, this been on the 1st December (maximum of -0.4°c) when after a very cold night the fog descended mid morning and stayed for the rest of the day. Sites such as Shap which stayed clear of the fog did see the temperature rise above freezing.
A selection of monthly mean temperatures is shown below:
RAINFALL
Quite widely 2019 was the wettest year since 2015 and as already mentioned, winter was the driest season across the county. Final averages when compared to the long-term averages were typically in the range of 105-117%.
At Newton Rigg the rainfall record commenced in 1900 (3yrs data is incomplete) and average rainfall for 1900-2018 was 927.4 mm. A final total of 1149.4 mm (124%) for 2019 makes it the 11th wettest year in its records.
However, there was no real sustained spell of wet weather during the year (the end of September, beginning of October being the closest to something resembling wet) and Seathwaite Farm in the Lake District was especially wet during 5-10th December, during which time it had daily falls of: 135.0 mm (5th), 71.2 mm (7th) and 80.0 mm (10th). That 135.0 mm being the highest 24Hr total during the year.
At Appleby In Westmorland 1044.3 mm (116.9%) made 2019 the 26th wettest in its record which commenced in June 1856. Staying with Appleby and looking at the decade as a whole, it throws up a few interesting details, one of which (which I save for last) is a little depressing:
In that record all the way back to 1856, this current decade (2010’s) has become the second wettest decade, although its average of 987.6 mm still lags some way behind the 1026.9 mm of the 1920’s.
But the 2010’s has provided, on average:
• the wettest June (75.3 mm)
• and less surprisingly, the wettest December (131.4 mm)
but with an average of 268.7 mm, the 2010’s has also experienced its wettest ... summers!
A selection of local rainfall totals from various standard sites is shown below:
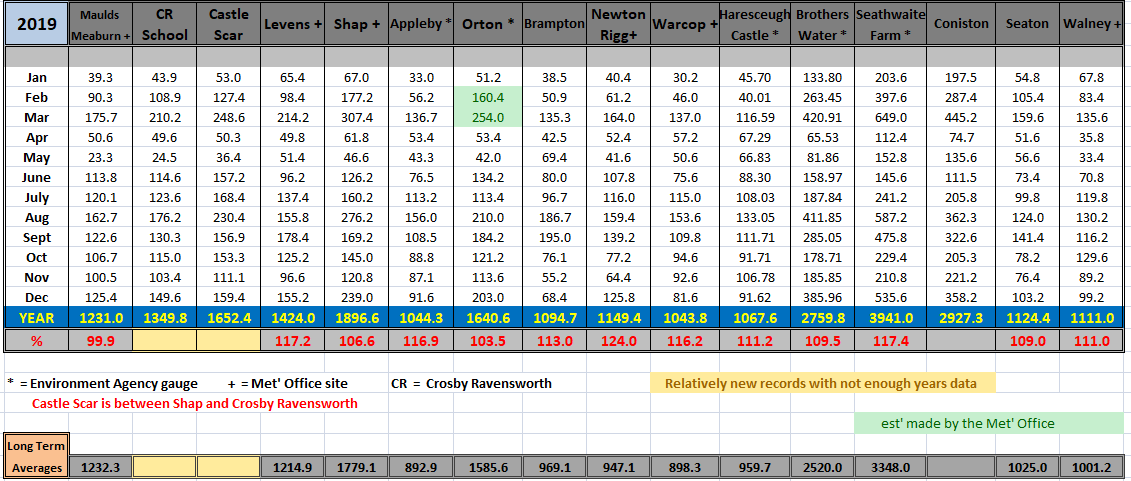
**‘Data kindly provided by the Hydrometry and Telemetry team of the Environment Agency (Penrith)’.
An even longer record is held for Seathwaite, back to 1845 (this being the 175th year). With 3941.0 mm of rain (155.18 in - 117.4%), 2019 has been the wettest year since 2017 - in its records 153 years have been drier and 21 have been wetter.
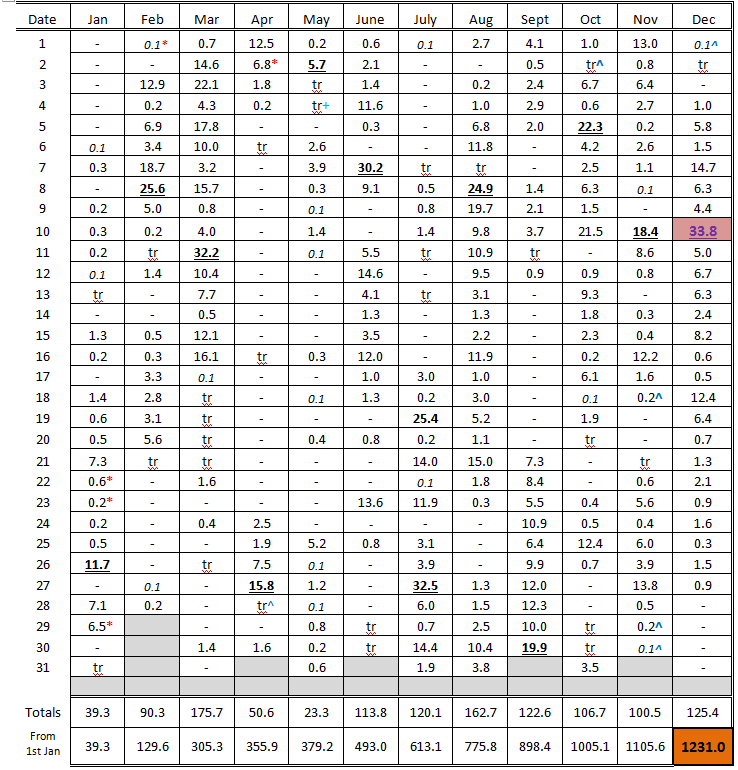
Rainfall at Maulds Meaburn was 1231.0 mm (48.46 inch) with rain recorded on 221 days (4.1 above average) of which 158 were 'wet days' (days of 1.0 mm=>)(3.1 below average).
This makes 2019 the fifth driest in my twelve complete years of records.
An inch or more of rain falling within 24hrs was recorded on six days and the year's wettest day, 33.8 mm on the 10th December represents just 2.75% of the annual total.
This is the fifth full year that I have had a rain gauge in Crosby Ravensworth (CR), just 0.7 miles from my own gauge in Maulds Meaburn (MM) and the monthly differences between the two remain relatively small.
The annual total of 1349.8 mm (53.14") at CR is 109.6% of that at MM and once again compares quite favourably to the previous four years (114.2% in 2015 - 110% in 2016+17 - 107.5 in 2018).
This is the fourth year of a gauge at CastleHowe Scar (between CR and Shap) and the final total of 1652.4 mm is still showing a fine correlation to that at MM and CR as the amount of rainfall increases closer to Shap.
In those four years the percentage difference between Castlehowe Scar and Maulds Meaburn have been:
2016 = 115.3% 2017 = 132.0% 2018 = 132.7% 2019 = 134.2%.
THE SEASONS
WINTER
Here in Cumbria the winter of 2018-19 just never really happened and that was despite the forecasters suggesting something cold following a 'Sudden stratospheric warming' (SSW) during December.
December did not even see a single flake of snow and February became incredibly warm with record breaking daily temperatures. Winter was confined to a very small corner of six days at the end of January and beginning of February. During this time snow that had fallen early on the 29th managed to hang about up to the 3rd and temperatures fell below -8.0°c on both the 31st and 3rd - and then that was it!
At Newton Rigg rainfall totalled 178.0 mm and had a mean temperature of 4.86°c. In comparison to the 1981-2010 averages this represents 63.4% of winter rainfall and it was 1.43°c warmer than average.
That made the winter of 2018-19 the 21st driest in a series back to 1900-01 (3 yrs of missing data) and in a series back to 1953-54 it is the 7th warmest. In the much longer series back to 1914-15, but with 8 missing years, it would be the 8th warmest.
SPRING
The season finished very average for temperature - whilst April was close to average, May then cancelled out a warmer than average March. Despite drought like conditions during April and which along with May were drier than average, it still managed to be the tenth wettest spring in Newton Rigg's records - all due to a very wet March.
At Newton Rigg rainfall totalled 258.0 mm and had a mean temperature of 7.97°c. In comparison to the 1981-2010 averages this represented 140.1% of spring rainfall and the mean temperature was slightly above average at 7.97°c by 0.2°c.
In a complete series back to 1952 (1 yr with data missing), 22 had been warmer and 45 have been colder.
SUMMER
The general consensus would be that despite having recorded the warmest day in living memory, summer has been fairly poor! Every month saw well over 100 mm of rain with August being especially wet with rain on virtually every day!
During the season there was no sustained warm spell and by contrast the 13th June failed to reach 10°c.
It would be easy to forget that the first 19 days of July hardly saw a drop of rain (and which continued the cool weather experienced in June) with just how wet August became and which was evenly spread throughout the month.
At Newton Rigg rainfall totalled 383.2 mm and had a mean temperature of 14.97°c. This represented 192.7% of summer rainfall and was 0.8°c warmer than average.
This made 2019 the second wettest to that of 1930 (440 mm) (3 years of incomplete data) and in a complete series back to 1952 it was the equal 9th warmest.
Rainfall at Seathwaite Farm this summer was 974.0 mm (156.8%) and since records began there in 1845 it is now the 14th wettest. To give a 'like for like' comparison with Newton Rigg, just using the period from 1900, it would have been Seathwaite's 7th wettest summer.
AUTUMN
was slightly drier but much colder than average.
It did not provide any extremes, but all three months were colder than their respective averages, especially the final two months which were both well in excess of 1°c below average, November experiencing some quite cold nights and a high number of air frosts. September only saw two days attain 20°c and for the first time, October's highest temperature was below 15°c.
However, and despite all three months notching up at least 100 mm of rain, the season was just drier than average! Rainfall was frequent but not especially heavy, the wettest period coming during the last ten days of September and through to the 10th October - those twenty days accounting for just over half (51.3%) of the entire fall for the season at Maulds Meaburn.
At Newton Rigg rainfall totalled 280.8 mm (99.1% of average) and had a mean temperature of 8.41°c (0.7°c colder than average).
That made the autumn of 2019 the 49th wettest in that series back to 1900 (3 yrs of missing data) and with 12 having been colder, 54 warmer and one with the same mean temperature in a series back to 1951 (1 year of missing data).
The following is the monthly breakdown of the weather at Shap during 2019.
OTHER - Maulds Meaburn data:
• A Mean Minimum of 5.11°c - Mean Maximum of 12.66°c
• During 2019 snow lay on the ground* on 6 days (6.7 below average) and was seen to fall on 14 (inc' sleet) with hail falling on 7 days.
• Fog* was recorded on 5 days with thunder heard on 8 days (4.1 above average).
• Mean cloud* cover was 79.1% with 141 days having a 100% cover* and 10 days being totally clear.
• Mean air pressure* was 1012.5 Mb - Lowest pressure was 969.4 Mb (13th Dec') and the highest was 1046.6 Mb++ (2nd Jan').
• Mean wind speed* was 7.04 Mph - the highest gust = 60 Mph (13th March) - the windiest day with a mean speed of 21.6 Mph was the 13th March.
• Gales (a 10 min' mean wind speed of 39 Mph) were recorded on one day.
• We had 55 air frosts (5.1 below average) - 117 ground frosts (0.2 below average) - with 40 days attaining 20°c+ (7.1 above average) of which 4 went on to attain 25°c (0.6 below average) and one 30°c.
• There was one 'Ice day' when the temperature remained below freezing all day.
• The 30 cm soil temperature had a mean of 10.2°c with a low of 2.0°c (4th Feb') and a high of 18.6°c (26th July).
• The 100 cm soil temperature had a mean of 10.2°c with a low of 5.1°c (7th Feb') and a high of 15.8°c++ (7th Aug').
• * Refers to 0900 GMT – the hour of observations.
• ++ = a new record for this site.
• Met' office data is still provisional for August onwards.
• THANKS:- There are several people whom I would like to thank for their help, support and assistance over the past year: For the supplying of data: to Susan Sandelands and Martin Wilson of the Hydrometry and Telemetry team at the Environment Agency (superbly efficient). And then to a my deputy observers who stand in for me when required, Alison, Margaret, Alan and especially Sarah.
        ------------------------------------------------------------------------------------------------------------------------------

                                  * 2019                 TEMP'     8.88°c         --          RAIN    1231.0 mm
                                  * 2018                 TEMP'     8.99°c         --          RAIN    1077.0 mm
                                  * 2017                 TEMP'     9.14°c         --          RAIN    1096.7 mm
                                  * 2016                 TEMP'     8.89°c         --          RAIN    1072.1 mm
                                  * 2015                 TEMP'     8.75°c         --          RAIN    1663.8 mm
                                  * 2014                 TEMP'     9.58°c         --          RAIN    1343.8 mm
                                  * 2013                 TEMP'     8.49°c         --          RAIN    1232.1 mm
                                  * 2012                 TEMP'     8.26°c         --          RAIN    1415.9 mm
                                  * 2011                 TEMP'     9.17°c         --          RAIN    1305.4 mm
                                  * 2010                 TEMP'     7.42°c         --          RAIN     702.9 mm
                                  * 2009                 TEMP'     8.86°c         --          RAIN    1264.5 mm
                                  * 2008                 TEMP'                    --          RAIN    1381.3 mm
JANUARY 2010
FEBRUARY 2010
MARCH 2010
APRIL 2010
MAY 2010
JUNE 2010
JULY 2010
AUGUST 2010
SEPTEMBER 2010
OCTOBER 2010
NOVEMBER 2010
DECEMBER 2010
JANUARY 2011
FEBRUARY 2011
MARCH 2011
APRIL 2011
MAY 2011
JUNE 2011
JULY 2011
AUGUST 2011
SEPTEMBER 2011
OCTOBER 2011
NOVEMBER 2011
DECEMBER 2011
JANUARY 2012
FEBRUARY 2012
MARCH 2012
APRIL 2012
MAY 2012
JUNE 2012
JULY 2012
AUGUST 2012
SEPTEMBER 2012
OCTOBER 2012
NOVEMBER 2012
DECEMBER 2012
SUMMER 2012
REVIEW OF 2012
JANUARY 2013
FEBRUARY 2013
MARCH 2013
APRIL 2013
MAY 2013
JUNE 2013
JULY 2013
AUGUST 2013
SEPTEMBER 2013
OCTOBER 2013
NOVEMBER 2013
DECEMBER 2013
REVIEW OF 2013
JANUARY 2014
FEBRUARY 2014
MARCH 2014
APRIL 2014
MAY 2014
JUNE 2014
JULY 2014
AUGUST 2014
SEPTEMBER 2014
OCTOBER 2014
NOVEMBER 2014
DECEMBER 2014
WINTER 2014
REVIEW OF 2014
JANUARY 2015
FEBRUARY 2015
MARCH 2015
APRIL 2015
MAY 2015
JUNE 2015
JULY 2015
AUGUST 2015
SEPTEMBER 2015
OCTOBER 2015
NOVEMBER 2015
DECEMBER 2015
REVIEW OF 2015
JANUARY 2016
FEBRUARY 2016
MARCH 2016
APRIL 2016
MAY 2016
JUNE 2016
JULY 2016
AUGUST 2016
SEPTEMBER 2016
OCTOBER 2016
NOVEMBER 2016
DECEMBER 2016
REVIEW OF 2016
JANUARY 2017
FEBRUARY 2017
MARCH 2017
APRIL 2017
MAY 2017
JUNE 2017
JULY 2017
AUGUST 2017
SEPTEMBER 2017
OCTOBER 2017
NOVEMBER 2017
DECEMBER 2017
REVIEW OF 2017
JANUARY 2018
FEBRUARY 2018
MARCH 2018
APRIL 2018
MAY 2018
JUNE 2018
JULY 2018
AUGUST 2018
SEPTEMBER 2018
OCTOBER 2018
NOVEMBER 2018
DECEMBER 2018
REVIEW OF 2018
JANUARY 2019
FEBRUARY 2019
MARCH 2019
APRIL 2019
MAY 2019
JUNE 2019
JULY 2019
AUGUST 2019
SEPTEMBER 2019
OCTOBER 2019
NOVEMBER 2019
DECEMBER 2019
OTHER ARTICLES
The Oldest Inhabitant
An Inch Of Scotch Mist
But it's meant to be Summer (Summer 2017)
© Darren Rogers 2010-19
Want to comment on this site? email