ADDITIONS MADE:
03.05.17. - 1917 - a snowy April.
07.03.15. - 1963 - problem with Mr. Fox.
12.02.14. - Now includes all monthly rainfall data for 1902-44 with comparisons to that of Appleby and Newton Rigg.
26.10.12. - Brief addition to the Morland chapter re rainfall data for 1877-78 at Morland Hall.
26.04.12. - Re Morland 1913
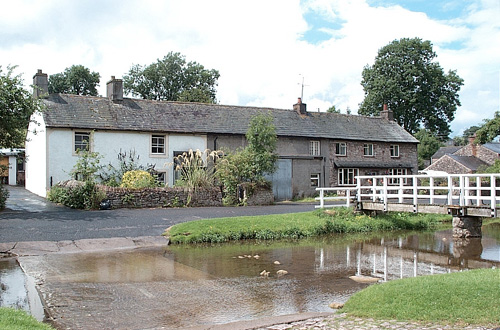
Sitting in the Vale of Lyvennet, Morland is a charming and picturesque village through which flows Morland Beck and which has a fine Saxon Church (St Lawrence). It is one of the loveliest in the county and parts of the fabric may well be the oldest masonry in any.
Morland also sits in a slight bowl and can experience colder overnight temperatures than other nearby locations. This is due to the fact that cold air sinks and will then sit within the 'bowl' of the village. But then it is also notably drier than other villages to its south, even Maulds Meaburn which is only some 4 miles away, with its rainfall being very similar to that of Appleby.
The main source of data for Morland is shown below, but initially we have two years worth of data for 1877-78 from Morland Hall - but these are figures that serve no useful purpose!
In 1877 we find a new observer to the Rainfall Guides of an E. Busfield at Appleby (Morland Hall), with a 5" gauge set at the height of 5ft above the ground, at a location 500 ft above sea level. Then in 1879 we learn that there were no observations made at the site.
The figures for the two years are: 32.64" on 200 days in 1877 and 25.03" on an unspecified number of days in 1878 and indeed the 1878 total is annotated with a ?
Just comparing the figures to Great Strickland and other local sites shows that those totals are far too low and certainly not trustworthy.
The Met' Office (along with the British Rainfall Guides) prove to be an excellent source of information regarding Morland and what is especially pleasing is the high number of years that rainfall observations were made there, running into decades.
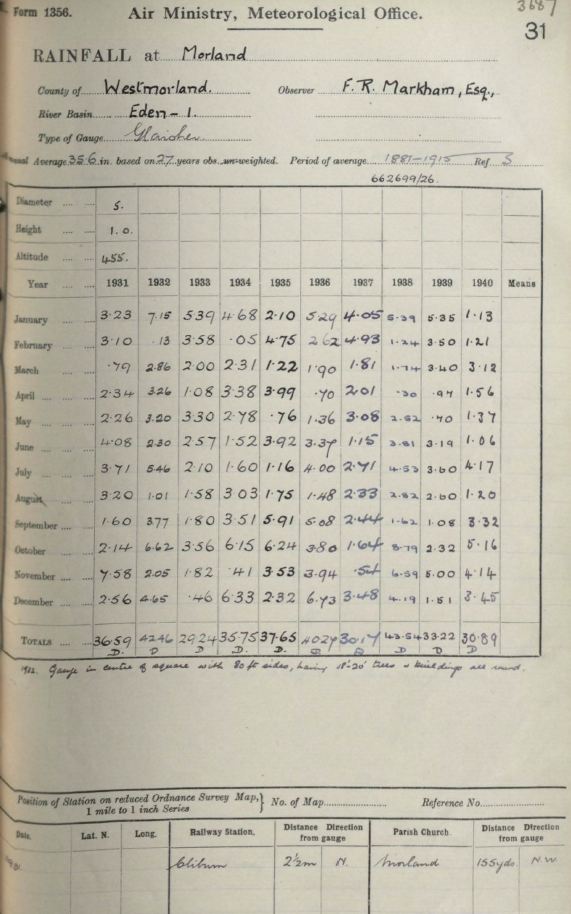
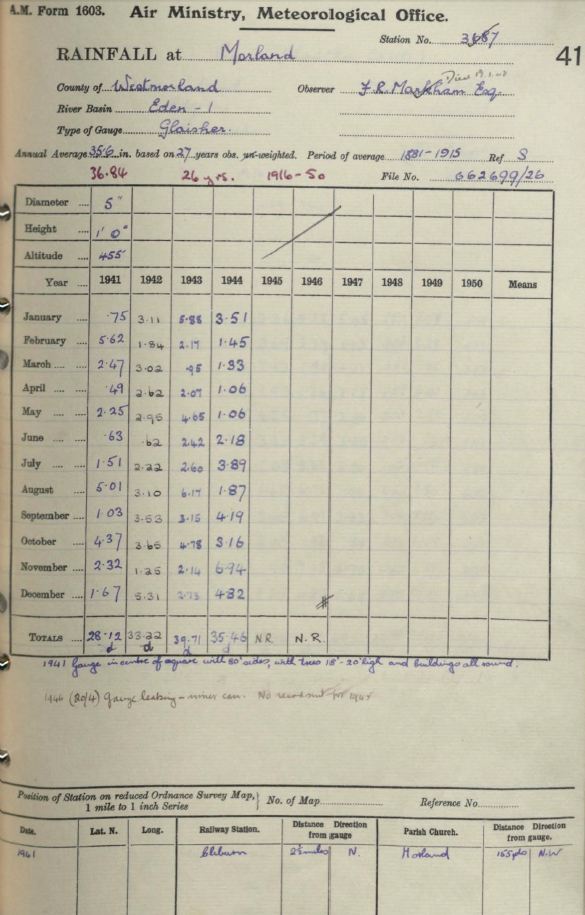
This was an official Met' Office rainfall site, station number 3687 and once again the monthly returns are held in the Met' Office archive (Ref: Archive V01. A-V05.A), copies of which I have been able to obtain.
The period covered is 1902 to 1944 and this includes all the monthly records as well as the annual returns. This is truly a superb historical rainfall history and one that meaningful comparisons can be made against.
I was slightly surprised by the low yearly average recorded, but what is worthy of note is that when comparing the totals quoted for Morland to those at the nearest sites such as Temple Sowerby, Appleby and Penrith, they are very much in keeping.
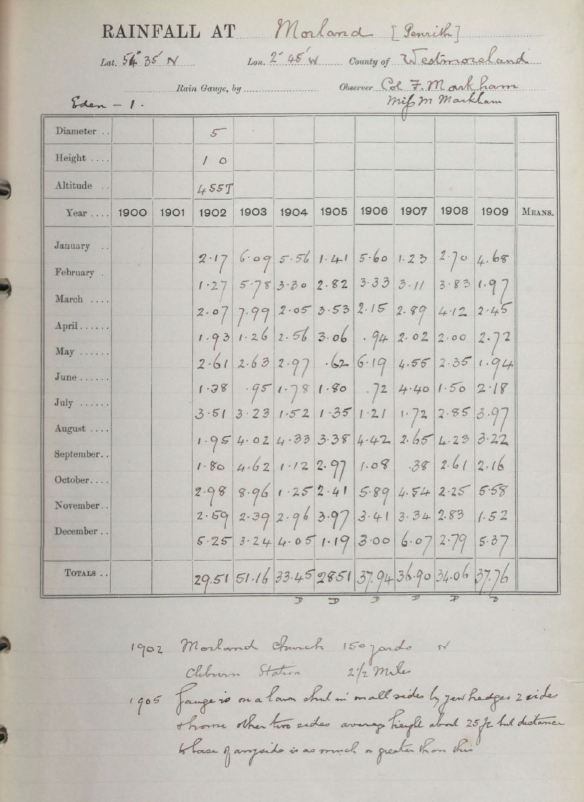
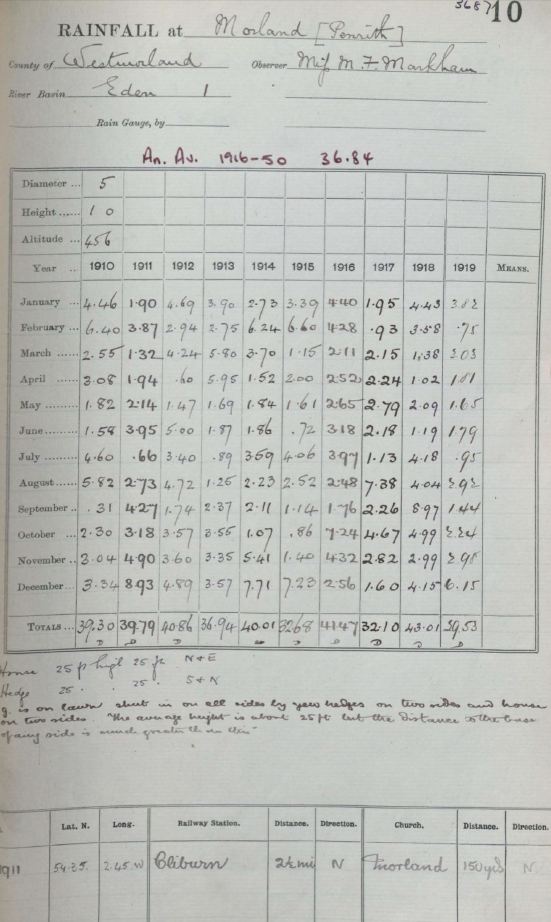
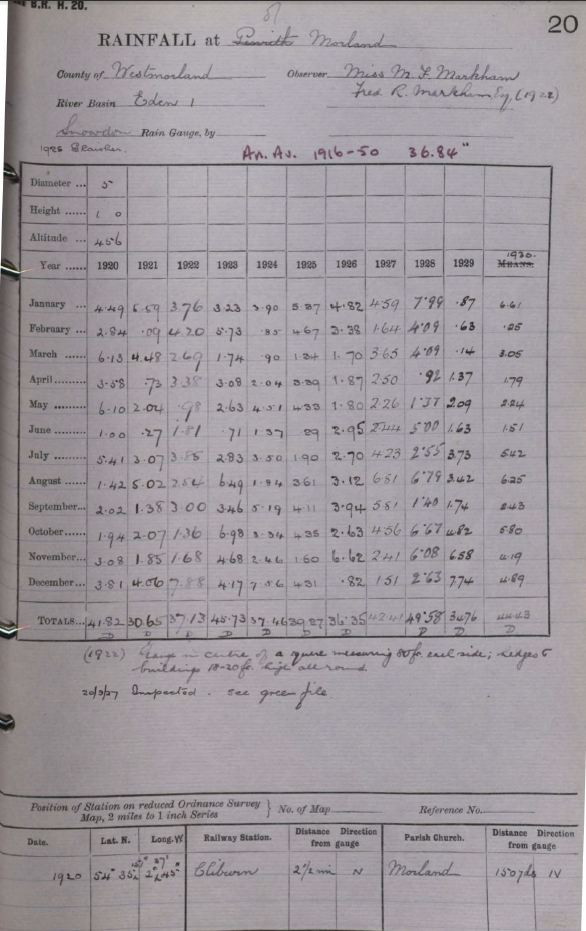
The observer listed for this site in 1902 is Col. F. Markham, but from 1903 is Miss M. Markham (in 1912 being slightly amended to Miss. M.F. Markham) and she is still shown as the observer in 1918. She employed a 5" gauge 1ft above the ground, at 456 Ft asl. Moving onto 1922 and the observer is listed as F.R. Markham esq with the gauge still at 456 Ft asl, then in 1925 the gauge is now shown at 455 Ft asl. The records held by the Met' Office have an annotatation against F.R. Markham which reads 'Died 19.1.48.'
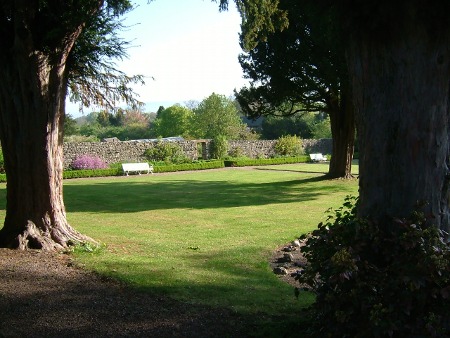
The comments alongside the Met' Office records confirm for myself that the rain gauge was located within the grounds of Morland House. The 1902-10 notes read 'Morland church 150 yards north' and 'gauge is on a lawn' and adds that there are various hedges around the sides some 25 Ft distant. Then in the 1931-40 records we now find that the gauge is sited 155 yards from the church at the new height, but there is no comment has to the reason why the gauge was moved.
From the 1930 edition to 1935, there are also entries for Morland Hall, observer a W.G. Shorrock, esq. Curiously in this period rainfall at Morland Hall was always less than that down in the village, in the range of 3-5 inches per year.
The full records are shown below. Further comments are made below:
The actual completed returns form for the Met' Office are shown below
For the 43 year period covered it gives an average yearly rainfall of 37.23 inches (945.6 mm) on 199.4 days per year.
The lawn as it appears today
These 43 years worth of figures are very consistent and the other figures that we have locally (Appleby) within the period 1902-1944 reinforces this consistency. In the 1934-36 guides an average yearly rainfall figure is supplied and for Morland this is quoted as 35.6 inches.
This average is for the period 1881 - 1915 (the actual mean was 37.06 inch), but as Morland's figures only commenced in 1902 they have been 'weighted' with figures from other nearby stations with records going back to 1881. However, using all of the 1902-44 records the mean of 37.23 inches just adds to the consistency of the entire period.
WETTEST AND DRIEST YEARS
Within the period 1902-1942 the wettest year is by far that of 1903 with 51.16 inches and it was the only time that 50 inches was exceeded in the entire period. Only 1928 with 49.58 inches comes anywhere near and only once (1927-28) was 40 inches exceeded in successive years.
Both 1903 and 1928 would be classed as 'very wet' years in that they had in excess of 25% of the average rainfall.
The driest year is that of 1941 with just 28.12 inch.
Applying the definitions of dry and wet years, etc, within the 43 years we find the following:
'Very Dry' years showing a departure from the average of more than 25% (less) - no years fall into this bracket.
'Dry' years being 10-25% less rainfall than average - numbers 13 and equates to 30.2%
'Average' years being +/- 10% of the average - is obviously the largest amount, numbering 20 and equates to 46.5%
'Wet' Years being 10-15% more than the average - numbers 8 and equates to 18.6%
'Very Wet' years showing a departure from the average of more than 25% (greater) - has just the two years of and equates to 4.7%.
The Orton chapter includes a brief analysis on the frequency of 'wet' and 'very wet' years as both the records for it and Morland are for a similar number of years and also see 'The frequency of 'Very Dry' and 'Very Wet' years in the Eden Valley - a new page coming soon.
The 'Dry' years were most notable in the period 1939-42 and which was the driest period in the whole series.
Whilst there were no 'Very Dry' years there were the eight (1916, 1918, 1920, 1923, 1927, 1930, 1932 and 1938) 'Wet' years and which after a 14 year wait for the first came fairly regularly thereafter.
The 'average' years were most prominent during 1906-1914, after which the period 1915-21 saw the greatest fluctuation as the years alternated from dry year to wet year during this time.
Regrettably the number of 'rain days' is not listed for 1941-44. This leaves 1940 with 137 Rain days as the year with the least rain days and 1903 with 249 rain days being the year with the most.
A few curiosities arise: the period 1902-10 had the lowest mean rainfall of the four decades but the highest number of days on which rain was recorded (rain days). Indeed there appears to be a trend in the number of rain days declining as the decades progress with marked falls from the 19teens and the 20's and then the 20's to the 30's.
When compared with the figures for Great Strickland, shown below, those 'Rain day' figures' become even more questionable, particularly for the period upto 1917. One possibility would be that on the days when there had been some rainfall, but less than 0.01" (A Rain Day) Miss. Markham still recorded it as a rain day. Otherwise Morland had less rain annually than Strickland, but on more days.
But I don't see anything in these figures that is unduly surprising other than the fact that the mean rainfall is more akin to that of Appleby than say a Reagill or Crosby Ravensworth.
COMPARISON WITH APPLEBY AND NEWTON RIGG
We can make direct comparisons for these three locations for the period 1902-44 and in many ways it is slightly curious to find that Appleby was just wetter than Newton Rigg, but there is nothing in it and Morland was the wettest of the three!
MORLAND = 945.6 mm APPLEBY = 933.2 mm NEWTON RIGG = 928.3 mm
In that time Morland recorded the wettest year on 18 occasions, Appleby on 15 and Newton Rigg on 10.
Morland and Newton Rigg both had 1903 as their wettest year in that period (1928 in Appleby) and Morland's driest year of 1941 was also the driest at Appleby (1905 in Newton Rigg).
Despite the fact that only 17.3 mm of rain separates the average of the three sites over 43 years there were some years that had fairly large margins, upto 102 mm (4 inch), with no bias to any one site. But the figures do show that in this particular area of Eden, rainfall is generally consistent and only becomes heavier as we head south and west.
WETTEST AND DRIEST MONTHS
The wettest month in the entire period was September 1918 with 8.97 inches (227.8 mm) and we find that only eight months in the entire period exceeded the 200 mm mark. The other notable wet months were 8.96" in October 1903, 8.93" December 1911 and 8.79" in October 1938.
The wettest decadal month was December during 1910-19 with 5.013" (127.3 mm) which is possibly unduly high especially when that average of 5.013 was only passed in four of the December's in that decade. For the five years of 1940-44 December was on average 1.4" drier and saw a continued decrease in the December rainfall.
The driest month in the entire period was February 1934 with just 0.05" (1.25 mm) and indeed the three driest months all fell in the month of February with 0.09" in 1921 and 0.13" in 1932.
What is no surprise at all is that April was on average the driest month for the entire period with a mean of 2.08" - but what may come as a surprise is that June with 2.09" was virtually as dry. Only four June's in the entire period recorded 4"+ of rain, with the most of 5" recorded in both 1912 and 1928, but otherwise June was a fairly reliable month with rainfall nearly always bordering on average.
Indeed the driest decadal month was June with 1.382" during 1940-44 and even if we discounted the 1940-44 period as too short, June during 1920-29 with 1.747" would still have been the driest decadal month.
But April was the driest and only once in the entire period did it top 4" of rain, 5.95" in 1913 (although with 3.99" in 1935 it was very close).
Both April and June recorded less than 1" of rain on eight occasions, closely followed by February with seven.
One curiosity that did strike me and is a good example of how much wetter it becomes as we go south of Morland, is that in 43 years Morland only recorded monthly rainfall in exces of 200 mm on seven occasions. A different era I know, but, here at Maulds Meaburn in less than 8 years (Upto Jan' 2014) I have recorded six occasions already.
1913 - 'The Finest Autumn'
Whilst I don't personally possess all of the editions of British Rainfall in the Morland series (I have 36), in those that I do have there is only year, 1913 (although from 1915 due to the on-set of the first world war, the rainfall guides no longer contained observers notes on the days, months and years), to which Markham does make a comment upon, it is thus:
'After a very wet early part of the year we had the smallest rain and the finest August, September and October ever known, as also the mildest autumn' - M.F. Markham
Markham also states that on the 29th October there was a heavy thunderstorm, no other details are provided. But the comment regarding a 'mild autumn' intrigues me further, was this comment based upon fact and hard data and was she also recording temperature as well?
1917 - Snowy April
Taken from 'The Cumberland and Westmorland Herald' on 15.4.2017. - their 'This week in history' section from 50 years ago
'Mr. and Mrs. Robert Parkin, East View, Morland, celebrated their golden wedding, having been married by the Rev. J. Knight on 7th April 1917 at St. Lawrence's Church. They recall that the wedding-day weather was far from spring-like and when the reception was held at Mr. Parkin's farm, snow fell heavily and remained for 2 weeks.'
But then for Morland that it very much it until Mr. Thwaites started recording the weather, but alas his records appear to be lost. This is a shame as Morland is recognised something of a frost hollow, as the following demonstrates:
1961 - Cold December - down to -20.5°c
Taken from 'The Cumberland and Westmorland Herald' on 3.12.2011. - their 'This week in history' section from 50 years ago
'This week saw the coldest night experienced at Penrith for over 20 years. The minimum temperature recorded at Queen Elizabeth Grammar school weather station was 3°F (-29 degrees below freezing point.) The last time the temperature dropped so low was in January 1940, when it reached zero (32 degrees of frost).
At Morland this week's weather has been even colder. The minimum registered on the thermometer of Mr. R. G. Thwaites, Lowergate, was minus 5°F (37 degrees of frost) at night.
At Appleby, Mr. J. F. Whitehead recorded a minimum temperature of 10F (22 degrees of frost) the lowest for many years.'
I have spoken with Mr. Thwaites and he informs me that he employed a Thermograph which was kept in a screen; this was located in his then quite substantial garden. Unfortunately he gave his Thermograph away and with it the records when seemingly on one even colder night (the date of which he does not re-call, the needle 'fell' of the bottom of the Thermograph and he thought that if he could not record the actual temperature then he was no longer interested and hence gave it way.
1963 - problem with Mr. Fox
After the infamous winter of 1963 the Cumberland and Westmorland Herald published a booklet entitled 'The Worst Winter of the Century' and in the introduction we read:
'Farmers problems did not end with the digging out of sheep and the finding of sufficient fodder. At Morland foxes, desperate for food, came down from the fells to raid poultry and lambs. A shotgun party, forty strong, turned out.'
RANDOM YEARLY COMPARISONS
Taking a few random years from the rainfall guides and trying to use Maulds Meaburn/Crosby Ravensworth as a central point we find some interesting points:
1918 - Morland recorded 43.01" with Ravenstonedale (The Chantry) having 62.61" - Appleby 43.47".
1934 - Morland recorded 35.75" with Appleby having 35.42" - Shap (Thornship Gill) 66.84" - Cliburn 32.63" - Temple Sowerby (The Grange) 29.47" - Ravenstonedale (railway stn) 46.25"
1936 - Morland recorded 40.27" with Appleby having 37.09" - Shap (Thornship Gill) 62.78" - Temple Sowerby 33.37" - Ravenstonedale (railway stn) 45.31"
© Darren Rogers 2012
Want to comment on this site or do you have any information that you would like to see included on this page? Please contact - email
                 Jan     Feb     Mar     Apr     May    June    July     Aug    Sept     Oct     Nov    Dec             YEAR

1902		 55.1	 32.3	 52.6	 49.0	 66.3	 35.1	 89.2	 49.5	 45.7	 75.7	 65.8	133.4		 749.6
1903		154.7	146.8	202.9	 32.0	 66.8	 24.1	 82.0	102.1	117.3	227.6	 60.7	 82.3	        1299.5
1904		141.2	 83.8	 52.1	 65.0	 75.4	 45.2	 38.6	110.0	 28.4	 31.8	 75.2	102.9		 849.6
1905		 35.8	 71.6	 89.7	 77.7	 15.7	 45.7	 34.3	 85.9	 75.4	 61.2	100.8	 30.2		 724.2
1906		142.2	 84.6	 54.6	 23.9	157.2	 18.3	 30.7	112.3	 27.4	149.6	 86.6	 76.2		 963.7
1907		 31.2	 79.0	 73.4	 51.3	115.6	111.8	 43.7	 67.3	  9.7	115.3	 84.8	154.2		 937.3
1908		 68.6	 97.3	104.6	 50.8	 59.7	 38.1	 72.4	107.4	 66.3	 57.2	 71.9	 70.9		 865.1
1909		118.9	 50.0	 62.2	 69.1	 49.3	 55.4	100.8	 81.8	 54.9	141.7	 38.6	136.4		 959.1

1910		113.3	162.6	 64.8	 78.2	 46.2	 40.1	116.8	147.8	  7.9	 58.4	 77.2	 84.8		 998.2
1911		 48.3	 98.3	 33.5	 49.3	 54.4	100.3	 16.8	 69.3	108.5	 80.8	124.5	226.8		1010.7
1912		119.1	 74.7	107.7	 15.2	 37.3	127.0	 86.4	119.9	 44.2	 90.7	 91.4	124.2		1037.8
1913		 99.1	 69.9	147.3	151.1	 42.9	 47.5	 22.6	 31.8	 60.2	 90.2	 85.1	 90.7		 938.3
1914		 69.3	158.5	 94.0	 38.6	 46.7	 47.2	 91.2	 56.6	 53.6	 27.2	137.4	195.8		1016.3
1915		 86.1	167.6	 29.2	 50.8	 40.9	 18.3	103.1	 64.0	 29.0	 21.8	 35.6	183.6		 830.1
1916		111.8	108.7	 53.6	 64.0	 67.3	 80.8	100.8	 63.0	 44.7	183.9	109.7	 65.0		1053.3
1917		 49.5	 23.6	 54.6	 56.9	 70.9	 55.4	 28.7	187.5	 57.4	118.6	 71.6	 40.6		 815.3
1918		112.5	 90.9	 35.1	 25.9	 53.1	 30.2	106.2	102.6	227.8	126.7	 75.9	105.4		1092.5
1919		 97.0	 19.1	 77.0	 46.0	 41.9	 45.5	 24.1	 74.2	 36.6	 56.9	 75.7	156.2		 750.1

1920		114.0	 72.1	155.7	 90.9	154.9	 25.4	137.4	 36.1	 51.3	 49.3	 78.2	 96.8		1062.2
1921		142.0	  2.3	113.8	 18.5	 51.8	  6.9	 78.0	127.5	 35.1	 52.6	 47.0	103.1		 778.5
1922		 95.5	106.7	 68.3	 85.9	 24.9	 46.0	 97.8	 64.5	 76.2	 34.5	 42.7	200.2		 943.1
1923		 82.0	145.5	 44.2	 78.2	 66.8	 18.0	 71.9	164.8	 87.9	177.3	118.9	105.9		1161.5
1924		 99.1	 21.6	 22.9	 51.8	114.6	 34.8	 88.9	 46.7	131.8	 84.8	 62.5	192.0		 951.5
1925		136.4	118.6	 34.0	 86.1	110.0	  7.4	 48.3	 91.7	104.4	110.5	 40.6	109.5		 997.5
1926		122.4	 85.9	 43.2	 47.5	 45.7	 74.9	 68.6	 79.2	100.1	 66.8	168.1	 20.8		 923.3
1927		116.6	 41.7	 92.7	 63.5	 57.4	 62.0	107.4	173.0	147.6	115.8	 61.2	 38.4		1077.2
1928		202.9	103.9	103.9	 23.4	 34.8	127.0	 64.8	172.5	 35.6	169.4	154.4	 66.8		1259.3
1929		 22.1	 16.0	  3.6	 34.8	 53.1	 41.4	 94.7	 86.9	 44.2	122.4	167.1	196.6		 882.9

1930		167.9	  6.4	 77.5	 45.5	 56.9	 38.4	137.7	158.8	 61.7	147.3	106.4	124.2		1128.5
1931		 82.0	 78.7	 20.1	 59.4	 57.4	103.6	 94.2	 81.3	 40.6	 54.4	192.5	 65.0		 929.4
1932		181.6	  3.3	 72.6	 82.8	 81.3	 58.4	138.7	 25.7	 95.8	168.1	 52.1	118.1		1078.5
1933		136.9	 90.9	 50.8	 27.4	 83.8	 65.3	 53.3	 40.1	 45.7	 90.4	 46.2	 11.7		 742.7
1934		118.9	  1.3	 58.7	 85.9	 70.6	 38.6	 40.6	 77.0	 89.2	156.2	 10.4	160.8		 908.1
1935		 53.3	120.7	 31.0	101.3	 19.3	 99.6	 29.5	 44.5	150.1	158.5	 89.7	 58.9		 956.3
1936		134.4	 66.5	 48.3	 17.8	 34.5	 85.6	101.6	 37.6	129.0	 96.5	100.1	170.9		1022.9
1937		102.9	125.2	 46.0	 51.1	 78.2	 29.2	 68.8	 59.2	 62.0	 41.7	 13.7	 88.4		 766.3
1938		136.9	 31.5	 44.2	  7.6	 71.6	 89.2	115.1	 71.6	 41.1	223.3	167.4	106.4		1105.9
1939		135.9	 88.9	 86.4	 24.6	 17.8	 81.0	 91.4	 66.0	 27.4	 58.9	127.0	 38.4		 843.8

1940		 28.7	 30.7	 79.2	 39.6	 34.8	 26.9	105.9	 30.5	 84.3	131.1	105.2	 87.6		 784.6
1941		 19.1	142.7	 62.7	 12.4	 57.2	 16.0	 38.4	127.3	 26.2	111.0	 58.9	 42.4		 714.2
1942		 79.0	 46.7	 76.7	 66.5	 74.9	 15.7	 56.4	 78.7	 89.7	 92.7	 31.8	134.9		 843.8
1943		149.4	 55.1	 24.1	 52.6	118.1	 61.5	 66.0	156.7	 80.0	121.4	 54.4	 69.3		1008.6
1944		 89.2	 36.8	 33.8	 26.9	 26.9	 55.4	 98.8	 47.5	106.4	 80.3	176.3	122.4		 900.7


  MEAN		102.4	 75.8	 67.1	 53.0	 62.9	 52.9	 76.3	 87.9	 70.7	103.0	 87.0	106.7		 945.6


Highest		202.9	167.6	202.9	151.1	157.2	127.0	138.7	187.5	227.8	227.6	192.5	226.8           1299.5
 Lowest		 19.1	  1.3	  3.6	  7.6	 15.7	  6.9	 16.8	 25.7	  7.9	 21.8	 10.4	 11.7 	         714.2


1900's		 93.5	 80.7	 86.5	 52.4	 75.8	 46.7	 61.5	 89.5	 53.1	107.5	 73.1	 98.3		 918.5
1910's		 90.6	 97.4	 69.7	 57.6	 50.2	 59.2	 69.7	 91.7	 67.0	 85.5	 88.4	127.3		 954.3
1920's		113.3	 71.4	 68.2	 58.1	 71.4	 44.4	 85.8	104.3	 81.4	 98.3	 94.1	113.0	        1003.7
1930's		125.1	 61.3	 53.5	 50.3	 57.2	 68.9	 87.1	 66.2	 74.3	119.5	 90.6	 94.3		 948.2
1940's		 73.1	 62.4	 55.3	 39.6	 62.4	 35.1	 73.1	 88.1	 77.3	107.3	 85.3	 91.3		 850.4


      TOP 10 DRY MONTH'S	       TOP 10 WET MONTH'S              TOP 10 WET YEARS	       TOP 10 DRY YEARS

1	1.3	Feb-34			227.8	Sep-18			1299.5	1903		714.2	1941
2	2.3	Feb-21			227.6	Oct-03			1259.3	1928		724.2	1905
3	3.3	Feb-32			226.8	Dec-11			1161.5	1923		742.7	1933
4	3.6	Mar-29			223.3	Oct-38			1128.5	1930		749.6	1902
5	6.4	Feb-30			202.9	Jan-28			1105.9	1938		750.1	1919
6	6.9	Jun-21				Mar-03			1092.5	1918		766.3	1937
7	7.4	Jun-25			200.2	Dec-22			1078.5	1932		778.5	1921
8	7.6	Apr-38			196.6	Dec-29			1077.2	1927		784.6	1940
9	7.9	Sep-10			195.8	Dec-14			1062.2	1920		815.3	1917
10	9.7	Sep-07			192.5	Nov-31			1053.3	1916		830.1	1915


	Winter	00's	272.4			Spring	00's	214.6			Summer	00's	197.7			Autumn	00's	233.7
		10's	315.3				10's	177.4				10's	220.6				10's	240.9
		20's	297.7				20's	197.7				20's	234.4				20's	273.8
		30's	280.7				30's	161.0				30's	222.1				30's	284.4
		40's	226.8				40's	157.3				40's	196.3				40's	269.9