Very Wet and Mild - wet winter and summer, beautiful spring - overall very poor - wettest year ever recorded at Seathwaite.
Locally it has been anywhere from the wettest year on record (Seathwaite), second wettest (Newton Rigg) or as low as the fourth wettest (Appleby) and with over 125% of average rainfall would be classed as a 'Very Wet' year - as for temperature, it has been the equal third warmest in the Newton Rigg record back to 1900, although at some sites it would be the fourth or fifth warmest.
Seathwaite Farm in the LDNP, where rainfall records commenced in 1845, created several notable and unwanted records this year: principally 2020 has been its wettest year on record!
In such a long record it is quite amazing that its two wettest years are only separated by five years, the second wettest being 2015 which included 'Storm Desmond' - but when you consider the other records that it broke during 2020 it really isn't surprising that 2020 has been its wettest year: its wettest ever summer when all three months notched up at least 400mm - by some margin its wettest February (which saw 900 mm surpassed in any month for only the fourth time) - its second wettest winter which now stands alongside that of 2015-16 ('Desmond' - 2118.4 mm) to have broken the 2000 mm threshold (78.74 In.) and are the only two seasons to have done so.
Whilst the majority of spring was dry, warm and notably sunny, the winter had been very mild and wet, culminating in a truly awful February which, with three named storms, had record breaking rainfall, saw Appleby-In-Westmorland under water once again and many without water for several days due to a mains water main being ruptured during 'Storm Ciara'. These two events were the most significant weather related impacts during the year.
And then the drought followed in the spring! After a poor first half to March, the rest of the season was just glorious, being warm, dry and very sunny.
The summer was very wet and just marginally warmer than average and with nothing that could be described as a warm spell, although it did have a one day hot spell (31st July) and was warm, but thundery during the 8-13th August.
The autumn trundled along with nothing of note with a very mild November off-setting the cooler than average months that had preceded it. However, it was wet and by the end of October the rainfall total was already above the annual average and still with two months of the year to go.
Overall, it has to be said that 2020 was not a good year!
TEMPERATURE
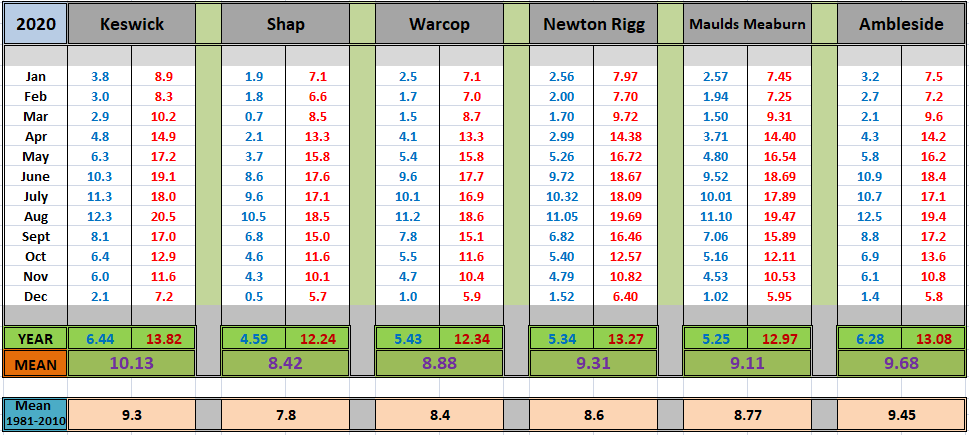
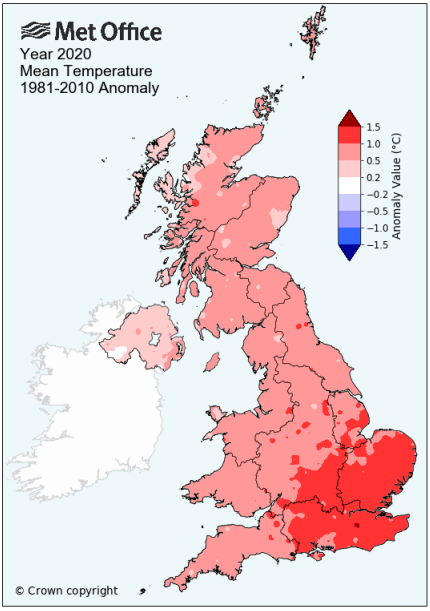
Locally all sites were warmer than average during 2020, ranging from +0.8�c at Keswick down to +0.2 at both Ambleside and Brampton and was typically in the range of +0.4 to 0.6°c.
Yet again this has seen Keswick, for at least the seventh year in succession, once again being just that little bit more above average than everywhere else - this year just beating Spadeadam which was 0.75°c above average.
With a mean temperature of 9.31°c (mean minimum of 5.34°c and mean maximum of 13.27°c) at Newton Rigg, 2020 becomes the 3rd warmest in a complete series back to 1957. That 9.3°c being 0.7°c above the 1981-2010 mean. The slight anomaly with Newton Rigg was that 2017 was colder than 2020, whereas at other sites 2017 was warmer and hence the reason for the slight discrepancy between 3rd/4th/5th warmest year.
Generally across Cumbria in 2020, 9 months were warmer than average during the year, with just 3 finishing colder - the months with the largest deviation from the norm' being (using Newton Rigg, but very much replicated at Shap): January at 2.0°c warmer, November 1.9°c warmer and each of the following were all at least 1.0°c above average as well: February, April and June.
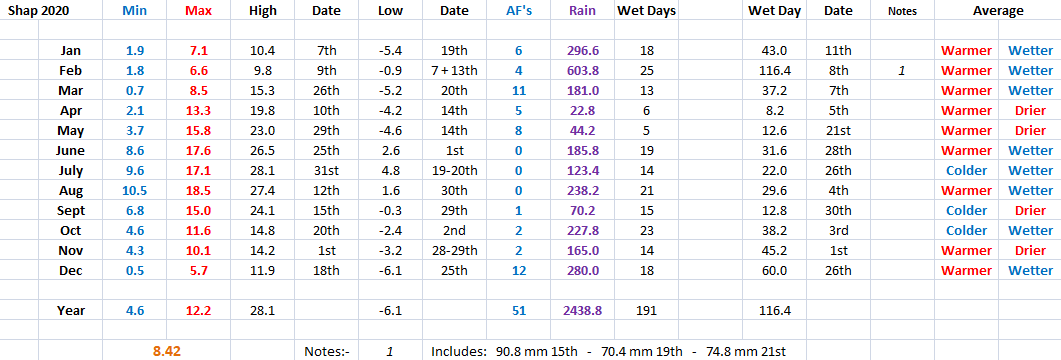
At the Met' Office site at Shap 51 air frosts were recorded during 2020, its average being 74.5 and which had an annual mean temperature of 8.42°c (0.6°c above average).
Cumbria maintained its wide spread of temperatures, the warmest and coldest sites having a margin of 2.0°c between them. This saw Spadeadam with a mean temperature of 8.1°c finishing exactly 2.0°c below that of Keswick.
Here at Maulds Meaburn a mean temperature of 9.11°c (mean minimum of 5.25°c and maximum of 12.97°c) was 0.34°c above the average for my short period of records for (2009-2019), but which is very much in keeping with the picture throughout Cumbria.
The highest and lowest temperatures recorded at a standard site during 2020 were: a maximum of 31.2°c (88.2°f - 12th August at Levens) and a minimum (excluding Great Dunn Fell) of -6.1°c (25th December at Shap and then also on 31st December at Ambleside).
Here at Maulds Meaburn it was: 29.5°c (85.1°f) 31st July and -5.2°c (22.6°f) on the 25th December.
A selection of monthly mean temperatures is shown below:
RAINFALL
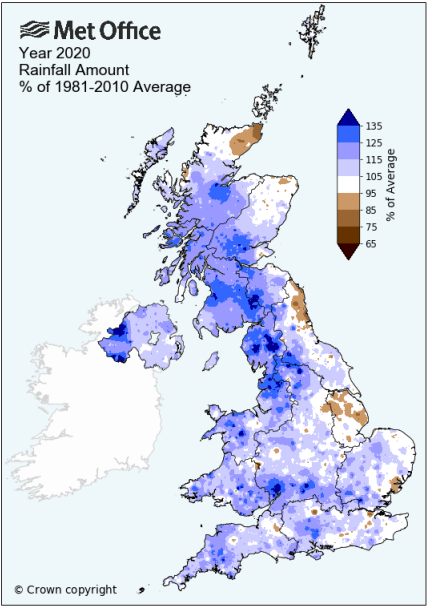
Quite widely 2020 was the wettest year since 2015, but as already mentioned, the wettest on record at Seathwaite - across the county final totals fell within the range of 125-150% of average, making it a 'Very Wet' year, ie: one exceeding 125% of average.
Seathwaite broke many records and it is somewhat hard to comprehend that its final total of 4991.8 mm (196.52 inch) equates to over half an inch of rain falling on every day of the year - and nearby at Honister the total was even higher!
February was the stand out month for rainfall with many sites falling just short of 350% average rainfall, whilst in April Ambleside only had 6% of its average fall.
At Newton Rigg the rainfall record commenced in 1900 (3yrs data is incomplete) and average rainfall for 1900-2019 was 929.0 mm. A final total of 1342.5 mm (141.7%) for 2020 makes it the 2nd wettest year in its records (to 1903) - whilst 1903 is the second wettest in the Appleby record, it is only the 13th wettest in the Seathwaite record.
At Appleby In Westmorland 1192.5 mm (133.4%) made 2020 the fourth wettest in its record which commenced in June 1856.
Because this is Cumbria it follows that the year will throw up a few surprises when it comes to rainfall, such as, in spite of there being three named storms during February, none of them provided the month's wettest day. At Honister 180.4 mm fell on the 19th, but then an even greater total fell in June during an event that was localised within the LDNP. This saw 212.8 mm (8.38 In.) fall at Honister on the 28th and which followed 113.2 mm on the 27th to provide a 48Hr total of 326.0 mm (12.83 In.), but fortunately after the dry spring levels in both rivers and lakes was very low at this time.
A selection of local rainfall totals from various standard sites is shown below:
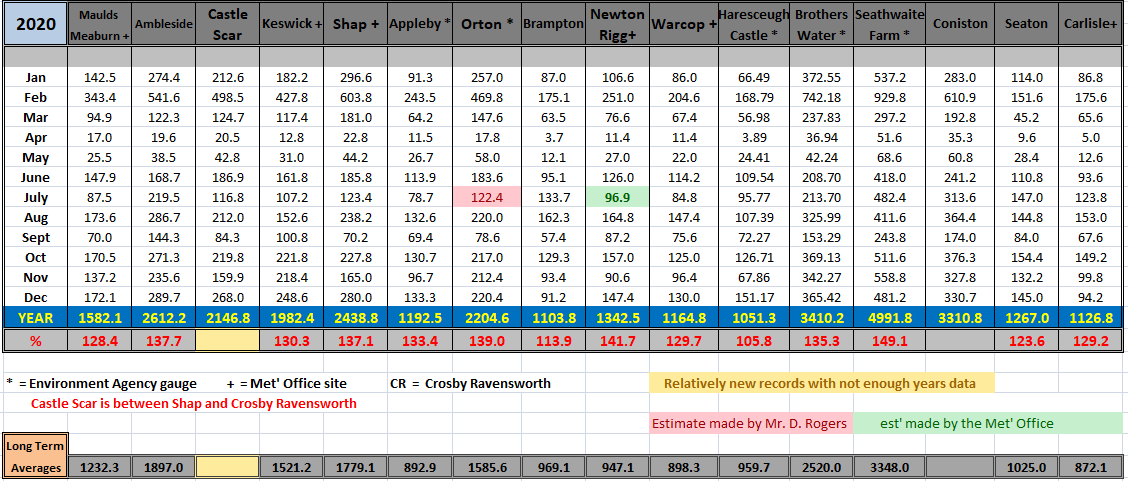
**�Data kindly provided by the Hydrometry and Telemetry team of the Environment Agency (Penrith)�.
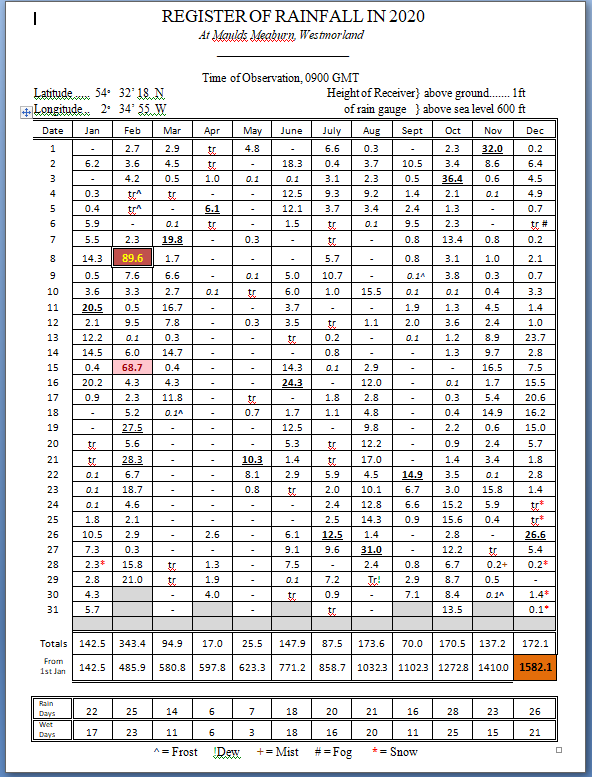
Rainfall at Maulds Meaburn was 1582.1 mm (62.29 inch) with rain recorded on 226 days (10.6 above average) of which 186 were 'wet days' (days of 1.0 mm=>)(25.3 above average).
This makes 2020 the second wettest (to 2015) in my thirteen complete years of records.
An inch or more of rain falling within 24hrs was recorded on 8 days and the year's wettest day, 89.6 mm on the 8th February represents 5.66% of the annual total.
'Droughts and Wet/Rain Spells' - during the year we had drought conditions through the spring and which saw a 39 day 'Partial Drought' from the 18th March through to 25th April during which just 7.3 mm of rain fell and which included a period of 'Absolute Drought' from the 6-25th April, 20 days when no measurable rain fell.
Maulds Meaburn also recorded four 'Rain Spells', which included one each in October, November and December, but the most significant one being the 19 days of 14th February to 3rd March when 227.9 mm fell.
The following is the monthly breakdown of the weather at Shap during 2020.
OTHER - Maulds Meaburn data:
� A Mean Minimum of 5.25°c - Mean Maximum of 12.97°c
� During 2020 snow lay on the ground* on 3 days (9.2 below average) and was seen to fall on 22 (inc' sleet) with hail falling on 14 days.
� Fog* was recorded on 3 days with thunder heard on 6 days (1.4 above average).
� Mean cloud* cover was 82.3% with 137 days having a 100% cover* and 7 days being totally clear.
� Mean air pressure* was 1012.3 Mb - Lowest pressure was 966.5 Mb (27th Dec') and the highest was 1047.2 Mb++ (19th Jan').
� Mean wind speed* was 7.79 Mph - the highest gust = 60 Mph (16th Feb') - the windiest day with a mean speed of 25.6 Mph was the 16th Feb'.
� Gales (a 10 min' mean wind speed of 39 Mph) were recorded on one day.
� We had 36 air frosts (23.6 below average) - 121 ground frosts (3.8 above average) - with 40 days attaining 20°c+ (6.5 above average) of which 7 went on to attain 25°c (2.3 below average).
� There was no 'Ice days' when the temperature remained below freezing all day.
� The 30 cm soil temperature had a mean of 10.4°c with a low of 3.0°c (31st Dec') and a high of 18.7°c (14th Aug').
� The 100 cm soil temperature had a mean of 10.2°c with a low of 5.6°c (7-8th March) and a high of 15.3°c (19th + 22nd Aug').
� * Refers to 0900 GMT � the hour of observations.
� ++ = a new record for this site.
� Met' office data is still provisional for August onwards.
� THANKS:- There are several people whom I would like to thank for their help, support and assistance over the past year: For the supplying of data: to Susan Sandelands and Martin Wilson of the hydrometry and Telemetry team at the Environment Agency (superbly efficient). And then to my deputy observers who stand in for me when required, Alison, Margaret, Alan and especially Sarah.
        ------------------------------------------------------------------------------------------------------------------------------

                                  * 2020                 TEMP'     9.11°c         --          RAIN    1582.1 mm
                                  * 2019                 TEMP'     8.88°c         --          RAIN    1231.0 mm
                                  * 2018                 TEMP'     8.99°c         --          RAIN    1077.0 mm
                                  * 2017                 TEMP'     9.14°c         --          RAIN    1096.7 mm
                                  * 2016                 TEMP'     8.89°c         --          RAIN    1072.1 mm
                                  * 2015                 TEMP'     8.75°c         --          RAIN    1663.8 mm
                                  * 2014                 TEMP'     9.58°c         --          RAIN    1343.8 mm
                                  * 2013                 TEMP'     8.49°c         --          RAIN    1232.1 mm
                                  * 2012                 TEMP'     8.26°c         --          RAIN    1415.9 mm
                                  * 2011                 TEMP'     9.17°c         --          RAIN    1305.4 mm
                                  * 2010                 TEMP'     7.42°c         --          RAIN     702.9 mm
                                  * 2009                 TEMP'     8.86°c         --          RAIN    1264.5 mm
                                  * 2008                 TEMP'                    --          RAIN    1381.3 mm
JANUARY 2010
FEBRUARY 2010
MARCH 2010
APRIL 2010
MAY 2010
JUNE 2010
JULY 2010
AUGUST 2010
SEPTEMBER 2010
OCTOBER 2010
NOVEMBER 2010
DECEMBER 2010
JANUARY 2011
FEBRUARY 2011
MARCH 2011
APRIL 2011
MAY 2011
JUNE 2011
JULY 2011
AUGUST 2011
SEPTEMBER 2011
OCTOBER 2011
NOVEMBER 2011
DECEMBER 2011
JANUARY 2012
FEBRUARY 2012
MARCH 2012
APRIL 2012
MAY 2012
JUNE 2012
JULY 2012
AUGUST 2012
SEPTEMBER 2012
OCTOBER 2012
NOVEMBER 2012
DECEMBER 2012
SUMMER 2012
REVIEW OF 2012
JANUARY 2013
FEBRUARY 2013
MARCH 2013
APRIL 2013
MAY 2013
JUNE 2013
JULY 2013
AUGUST 2013
SEPTEMBER 2013
OCTOBER 2013
NOVEMBER 2013
DECEMBER 2013
REVIEW OF 2013
JANUARY 2014
FEBRUARY 2014
MARCH 2014
APRIL 2014
MAY 2014
JUNE 2014
JULY 2014
AUGUST 2014
SEPTEMBER 2014
OCTOBER 2014
NOVEMBER 2014
DECEMBER 2014
WINTER 2014
REVIEW OF 2014
JANUARY 2015
FEBRUARY 2015
MARCH 2015
APRIL 2015
MAY 2015
JUNE 2015
JULY 2015
AUGUST 2015
SEPTEMBER 2015
OCTOBER 2015
NOVEMBER 2015
DECEMBER 2015
REVIEW OF 2015
JANUARY 2016
FEBRUARY 2016
MARCH 2016
APRIL 2016
MAY 2016
JUNE 2016
JULY 2016
AUGUST 2016
SEPTEMBER 2016
OCTOBER 2016
NOVEMBER 2016
DECEMBER 2016
REVIEW OF 2016
JANUARY 2017
FEBRUARY 2017
MARCH 2017
APRIL 2017
MAY 2017
JUNE 2017
JULY 2017
AUGUST 2017
SEPTEMBER 2017
OCTOBER 2017
NOVEMBER 2017
DECEMBER 2017
REVIEW OF 2017
JANUARY 2018
FEBRUARY 2018
MARCH 2018
APRIL 2018
MAY 2018
JUNE 2018
JULY 2018
AUGUST 2018
SEPTEMBER 2018
OCTOBER 2018
NOVEMBER 2018
DECEMBER 2018
REVIEW OF 2018
JANUARY 2019
FEBRUARY 2019
MARCH 2019
APRIL 2019
MAY 2019
JUNE 2019
JULY 2019
AUGUST 2019
SEPTEMBER 2019
OCTOBER 2019
NOVEMBER 2019
DECEMBER 2019
REVIEW OF 2019
JANUARY 2020
FEBRUARY 2020
MARCH 2020
APRIL 2020
MAY 2020
JUNE 2020
JULY 2020
AUGUST 2020
SEPTEMBER 2020
OCTOBER 2020
NOVEMBER 2020
DECEMBER 2020
OTHER ARTICLES
The Oldest Inhabitant
An Inch Of Scotch Mist
But it's meant to be Summer (Summer 2017)
© Darren Rogers 2010-19
Want to comment on this site? email